20061130 Pivot Levels for 1 Dec 2006.
posted by emacro @ 10:32 PM
0 comments
![]()
![]()
This will chronicle trading in the FKLI & FCPO futures. If you don't like what you see/read in this blog, just surf away. These opinions are our personal opinions and just a record of our thoughts..."In evolution, it’s not the biggest, the fiercest nor the smartest that survive, it’s the one that changes the fastest.” I.e. the key word is to adapt the trading style to the markets, until it stops working
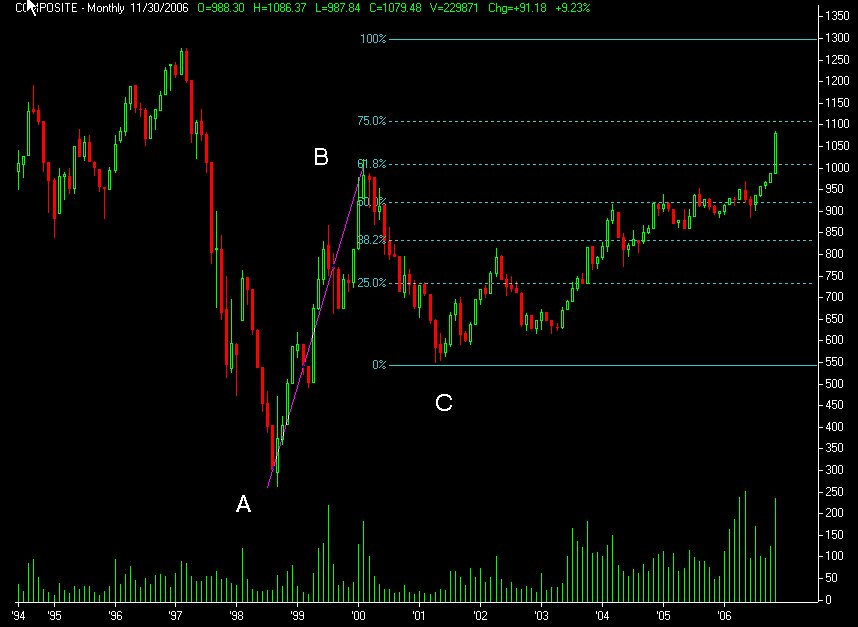 20061130 Some participants in the market like to indulge in long term forecasting or "looking into the crystal ball". These are forecasts of target levels where they think an instrument or index might 'reach". This can be dangerous, as it will create a 'bias' in a trader/investor's minds, and thus they throw risk management out of the window.(stop loss) In truth long term trading or trend following can be a difficult task, and often requires a higher pain threshold of risk. But here goes anyway, I'll dabble in this for a bit of fun. If you look at the monthly chart of the KLCI, and project the Fib levels of the move from A to B, from C, we get an ultimate target level of around 1290. Bear in mind that it will take months to reach that level, if it ever comes at all.
posted by emacro @ 10:06 PM
0 comments
![]()
![]()
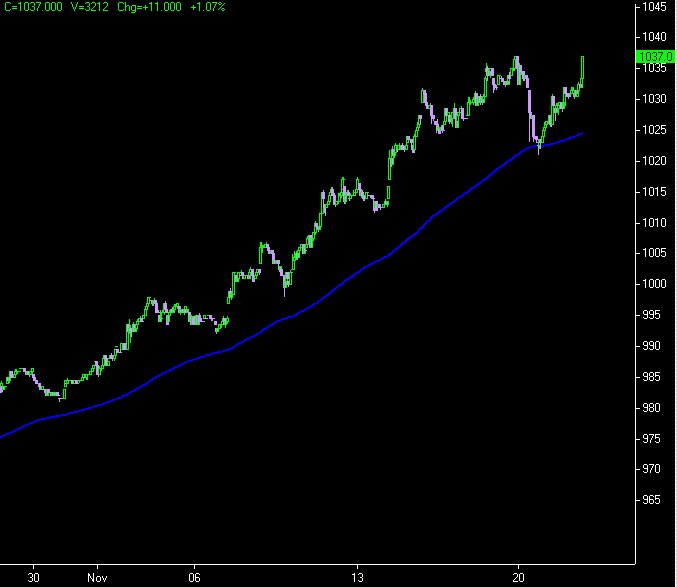
 20061130 Tomorrow we will see the headlines such as "KLCI at 9 year high", "KLCI breaches 1080 due to foreign buying" blah blah blah. And aussie bank ANZ forking our RM4.30 for additional stake in AMMB, a 40% premium to last traded price. Is this irrational exuberance, or do they know something we don't. What are the signals the market is giving us? Time will tell.
posted by emacro @ 7:22 PM
0 comments
![]()
![]()
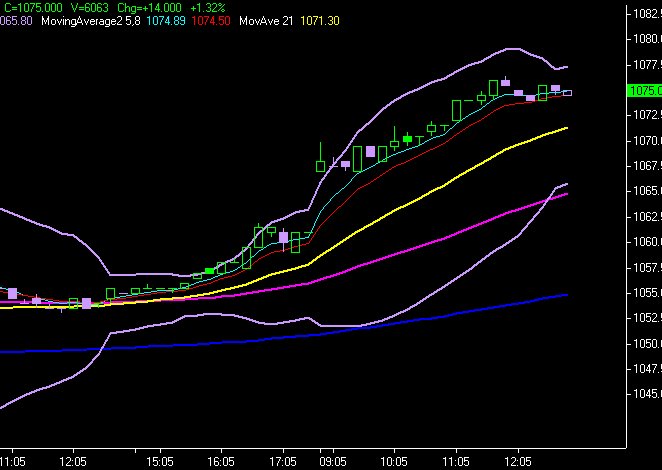 20061130 12:45pm. 15 min chart show clearly the breakout from consolidation and subsequent trend. Pivot breakouts provide clue too.
posted by emacro @ 1:54 PM
0 comments
![]()
![]()
 20061129 11:37 am. FKLI Dec gaps up, but we can see something interesting here. An uptrendline is about to be tested.
posted by emacro @ 11:42 AM
0 comments
![]()
![]()
 20061128 5:15 pm. FKLI settles at 1053, with a low print of 1051. Some key levels to watch for tomorrow is set by the pivots, where we might look to set up long trade to hold into settlement of the November FKLI.
posted by emacro @ 5:23 PM
0 comments
![]()
![]()
 20061128 3:11 pm. With FKLI quoting 1057.5/58, below the M1 level, FKLI looks weak with good chance to test lower levels.
posted by emacro @ 3:11 PM
0 comments
![]()
![]()
 20061128 12:13 pm. FKLI declines, helping the short trade. The big picture of the market was the overextended technical indicators on the daily chart, which left it vulnerable to news shock, like the 156 point delcine of the DJIA last night.
posted by emacro @ 12:15 PM
0 comments
![]()
![]()
 20061127 12:45 pm. We have the news release of the mega-plantation deal, the acquirer will pay 5% premium to last traded price in cash or shares in the new company equivalent. FKLI already looks to roll over, could be a case of 'buy the rumour, sell the fact'. Maybe we can look for shorting opportunity.

posted by emacro @ 2:39 PM
0 comments
![]()
![]()
 20061125 Nowadays when you open up the business pages of a newspaper like thestat.com.my, it becomes apparent the direction of the fund flows that enter the market. Nowonder the index has performed spectacularly in 2006 to date. Even in Magnum's case, years of depressed share price due to insider selling, now shows the hand of the insiders, who make a General Offer to buy back the shares they sold at RM2.30. Hold on to the shares, don't sell to MPHB. Make them buy back at higher prices, because they have pummeled down the shares via insider info all these years. The ANZ AMMB stake acquisition also herald the new wave of foreign investment flowing into Bursa market. This is made possible by the openess and progressive thinking of the new leadership in the Badawi government. Dr Mahathir should be sharing in this prosperity prospect. Althugh we need Dr M as an avenue of checks and balances, through free speech. He can do much good, especially to curb the radical thinking, especially the cowboy attitude of those in UMNO youth.
posted by emacro @ 9:56 PM
0 comments
![]()
![]()
 These are the pivot levels for the FKLI, and can serve as useful references for S/R for trading on Monday 27 Nov 2006. This is one of a plethora of free calculators on the web that spit out pivot levels.
posted by emacro @ 8:06 PM
0 comments
![]()
![]()
 20061124 5:15 pm. FKLI closes near the multi year high. The rally in November has been breathtaking, to say the least. No doubt many have been taken by surprise. Everybody sees the 'overbought' conditions, but the market just keeps going up. We'll see how sustainable this is going forward.
posted by emacro @ 7:40 PM
0 comments
![]()
![]()
 20061122 10:54 am. FKLI reaches the 161.8% extension of yesterday's range.
posted by emacro @ 11:25 AM
0 comments
![]()
![]()
 20061121 5:15 pm. In hindsight, we see the better support level to get long was the 200 ema on the 15 min FKLI chart, rather than the 30 min chart.
posted by emacro @ 5:47 PM
0 comments
![]()
![]()
 20061120 5:15 pm. If we take the opinion that the current bullish phase of the market will continue into the end of the year, then it would be best to look for an area of support to establish longer term long positions. An idea would be to look at the 200 ema on the longer term intraday timeframes.(30 min on this chart) In the shorter term, (top chart) we can see the candle bodies on the way down are larger than those on the right hand rectangular area, indicating shorter term there is more downside. This would tie up nicely into the'buy at support' scenario in the bottom chart.
posted by emacro @ 8:16 PM
0 comments
![]()
![]()
 20061120 12:30 pm. An example of how traders/investors/analysts can get ahead of themselves in bias. This is one of a smattering of 'bullish' comments that analysts can come up with for today. In the Malaysian stock market, there is a potentially dangerous bias participants take. This a 'bullish' stance. this is because of the one directional view of trading, that is on the long side, be it stocks, warrants, convertible instruments etc. When people get too far ahead of themselves in this 'bullish' bias, the market usually turns around to drop (like this morning) or move into a larger consolidation pattern. Trading derivatives like futures on stock indices and stocks, do provide a very good advantage in the two dimensional aspect: the ability to short, along with the ability to trade long.
posted by emacro @ 1:53 PM
0 comments
![]()
![]()
 20061120 0857 am. This appeared in thestar.com.my this morning. So it seems the masses are waking up to the bull market. When analysts and retailers get excited, usually it signals the market would likely pause or stop the uptrend, moving into a period of consolidation and back and forth trading to digest the overbought conditions.
posted by emacro @ 9:08 AM
0 comments
![]()
![]()
 20061117 5:15 pm. Looking at the daily chart of the FKLI, we can see the speed and extent of the current bull movement in price. RSI is at overbought levels, but there is yet to be any divergence forming, so this doesn't give any clue as to any end to the trend yet. Although the MACD is climbing st a steep level, which also indicates unsustainability, the MACD histogram says otherwise, pointing to continued momentum. How best to trade this? One idea would be to look for a retracement and somehow enter in the direction of the uptrend. But we will have to observe price action to confirm any biases.
posted by emacro @ 1:52 PM
0 comments
![]()
![]()
10:47 am FKLI 30 min chart shows possible triple top formation, indicting possibility of short term reversal down. Might look to set up some short trade.
posted by emacro @ 10:57 AM
0 comments
![]()
![]()
 20061115 5:15 pm. Sometimes a simle system to trade mechanically can reap good returns to a trader.
posted by emacro @ 5:57 PM
0 comments
![]()
![]()
 20061115 Article highlights the structural problems gegetting the Bursamalaysia stock and derivatives markets, one of "Asia's most thinly traded stock markets."
posted by emacro @ 4:52 PM
0 comments
![]()
![]()
 20061115 11:05 am. KLCI on dailies, seemed to have reached the 161.8% extension level, could be correction coming.
posted by emacro @ 11:16 AM
0 comments
![]()
![]()
 20061115 10:05 am. FKLI moves up in tandem with new high on KLCI cash index. Long position from yesterday, looks good to lock in some profits and let some runners run.
posted by emacro @ 10:17 AM
0 comments
![]()
![]()
 20061114 5:15 pm. Price action on FKLI was a selloff into lunch sessin break, with recovery into the close of the day. This action looks to be the expected profit taking, with the recovery indicating some strength in the FKLI market to upside. So we take longs at 1015.50. The profit taking also serves some way toward alleviating the overbought conditions.
posted by emacro @ 5:38 PM
0 comments
![]()
![]()
 12:45 pm. FKLI chart with a level of support.(Fib clusters) Might look for longs at those levels.
posted by emacro @ 1:41 PM
0 comments
![]()
![]()
 20061109 9:04 am. FKLI gaps up on the recovery on Wall St. The expected 'epic sell off' on the US stocks due to the US elections outcome did not materialise last night. FKLI bounced off support (ellipse) late yesterday afternoon, lending support to the bounce.
posted by emacro @ 9:22 AM
0 comments
![]()
![]()
 20061108 5:15 pm. FKLI correcting nto the close, may be expecting profit taking to kick in on the cash market.
posted by emacro @ 7:00 PM
0 comments
![]()
![]()