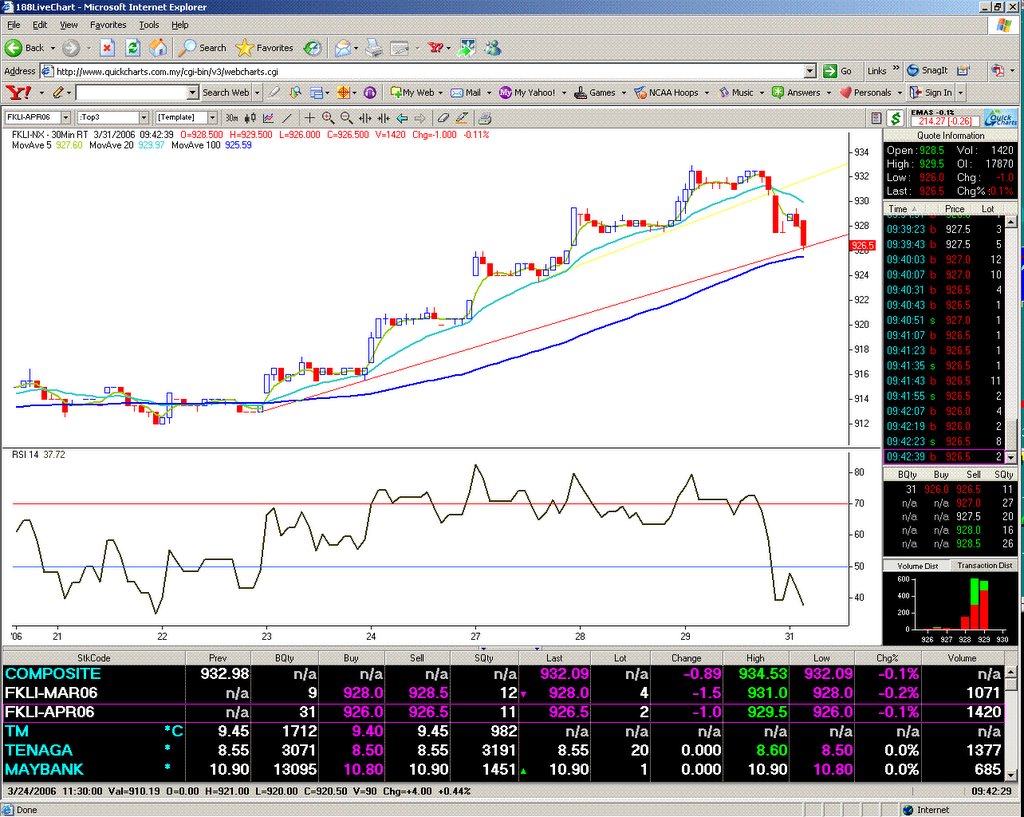
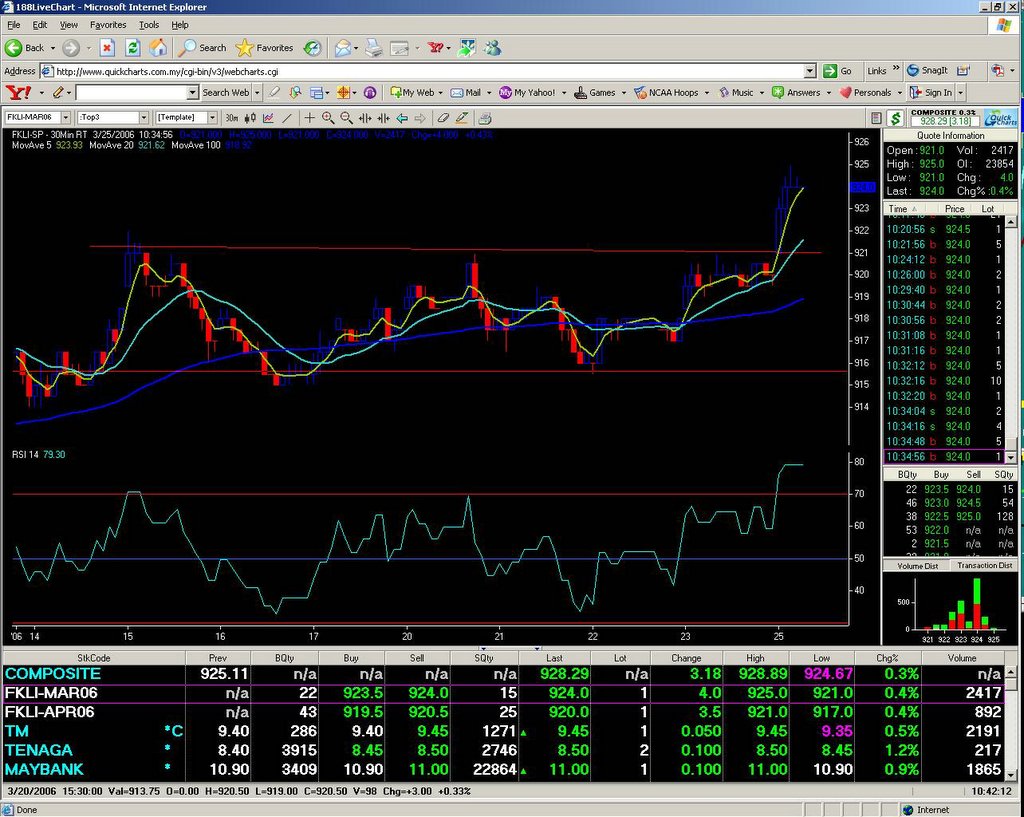
 20060330 9:42 am. Hits the target at the uptrend line 926.
posted by emacro @ 9:47 AM
0 comments
![]()
![]()
This will chronicle trading in the FKLI & FCPO futures. If you don't like what you see/read in this blog, just surf away. These opinions are our personal opinions and just a record of our thoughts..."In evolution, it’s not the biggest, the fiercest nor the smartest that survive, it’s the one that changes the fastest.” I.e. the key word is to adapt the trading style to the markets, until it stops working
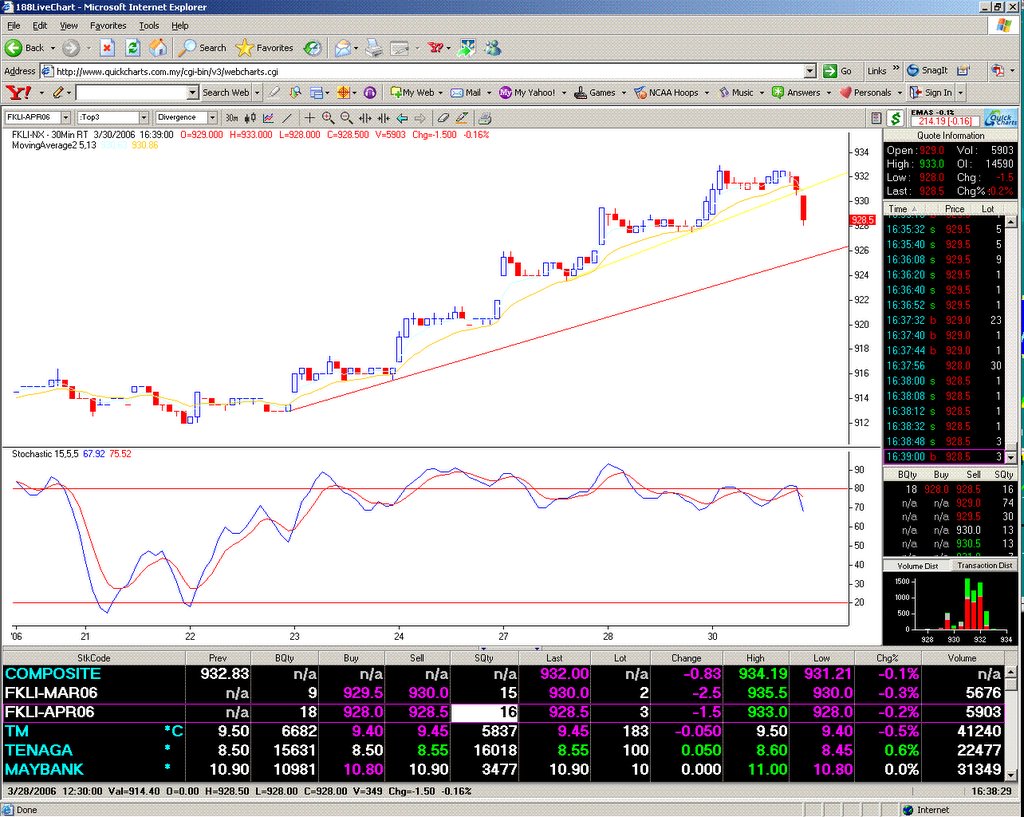 20060329 4:39 pm. For those short on divergence setup, a viable target wound be the red uptrend line below, around 926.
posted by emacro @ 4:41 PM
0 comments
![]()
![]()
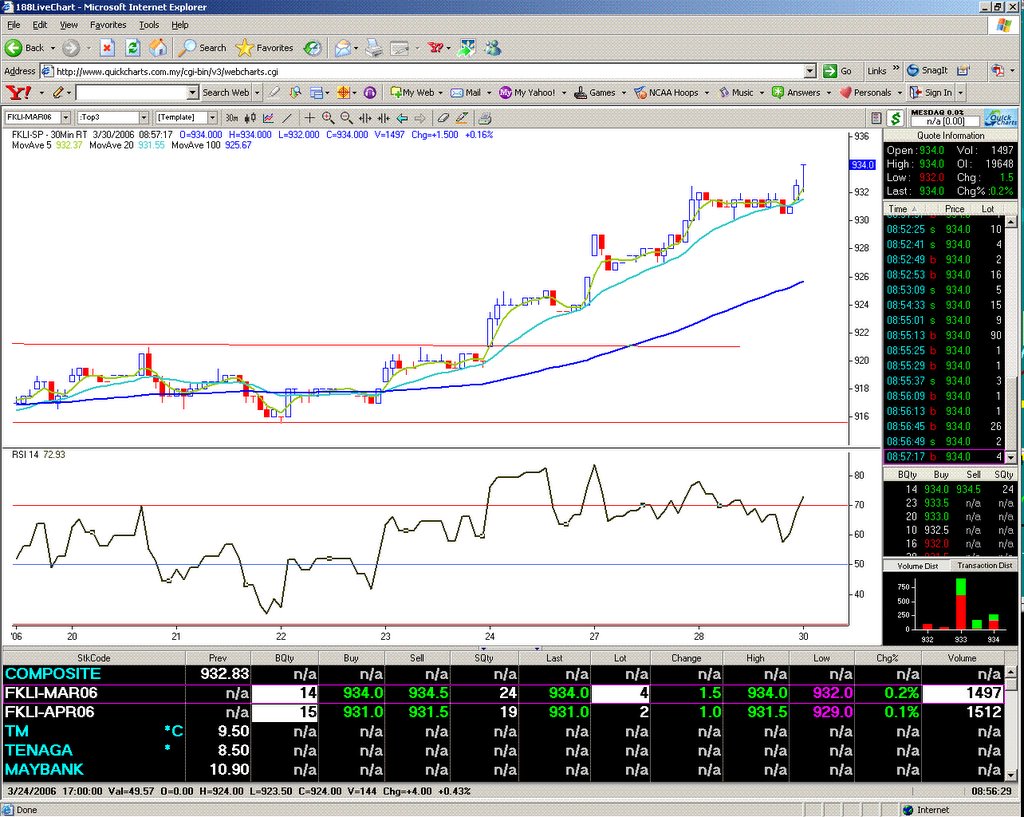
 20060329 4:28 pm. Few points ot note on this 30 min chart. 1) Divergence between price and indicator 2) Price is coming to test an uptrend line. Could well be a setup for a divergence short on the April FKLI. Stop would be above the high.
posted by emacro @ 4:30 PM
0 comments
![]()
![]()
 20060329 April FKLI futures and the classic staircase pattern.
posted by emacro @ 12:44 PM
0 comments
![]()
![]()
 20060329 12:23 pm. Genting Bhd, since the breakout identified at RM21.60, now trades at RM24.40. Stock trading needs a certain discipline to be able to hold on to a winning position, and patience is very important.
posted by emacro @ 12:30 PM
0 comments
![]()
![]()
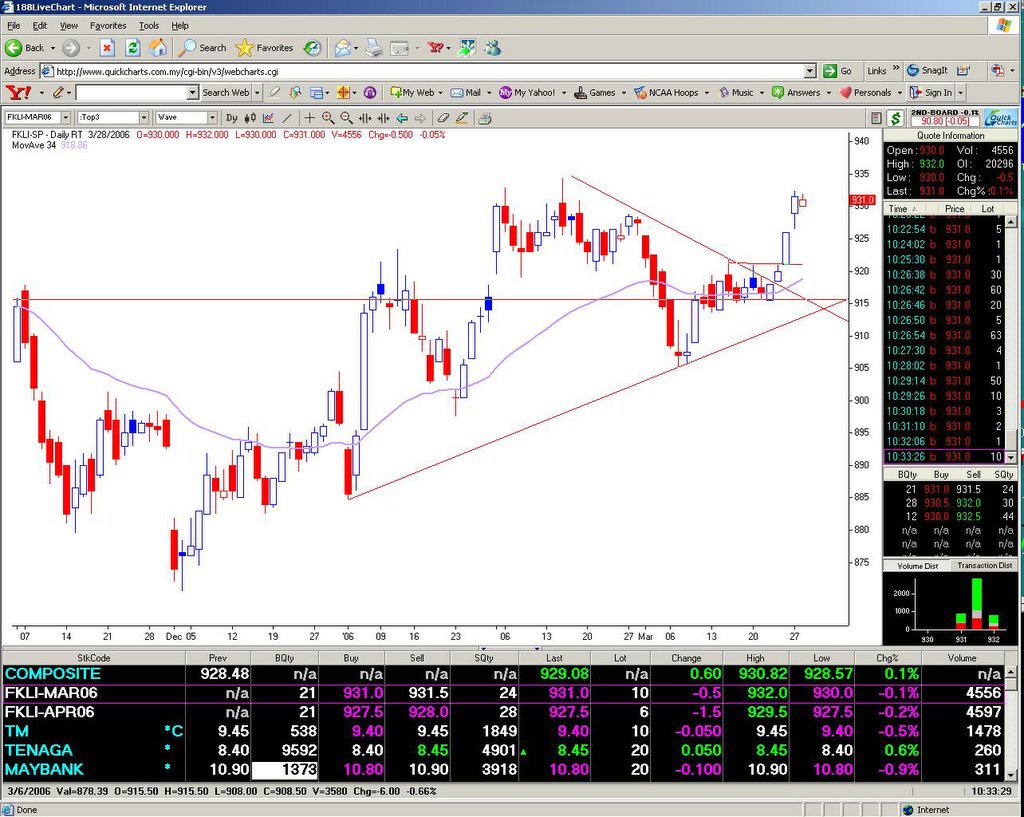 20060328 Big picture view of FKLI daily chart tells the story of the breakout
posted by emacro @ 11:12 AM
0 comments
![]()
![]()
posted by emacro @ 5:22 PM
0 comments
![]()
![]()
 20060327 9:00 am. FKLI opens gap up and reache target.(width of previous sideways consolidation)
posted by emacro @ 9:02 AM
0 comments
![]()
![]()
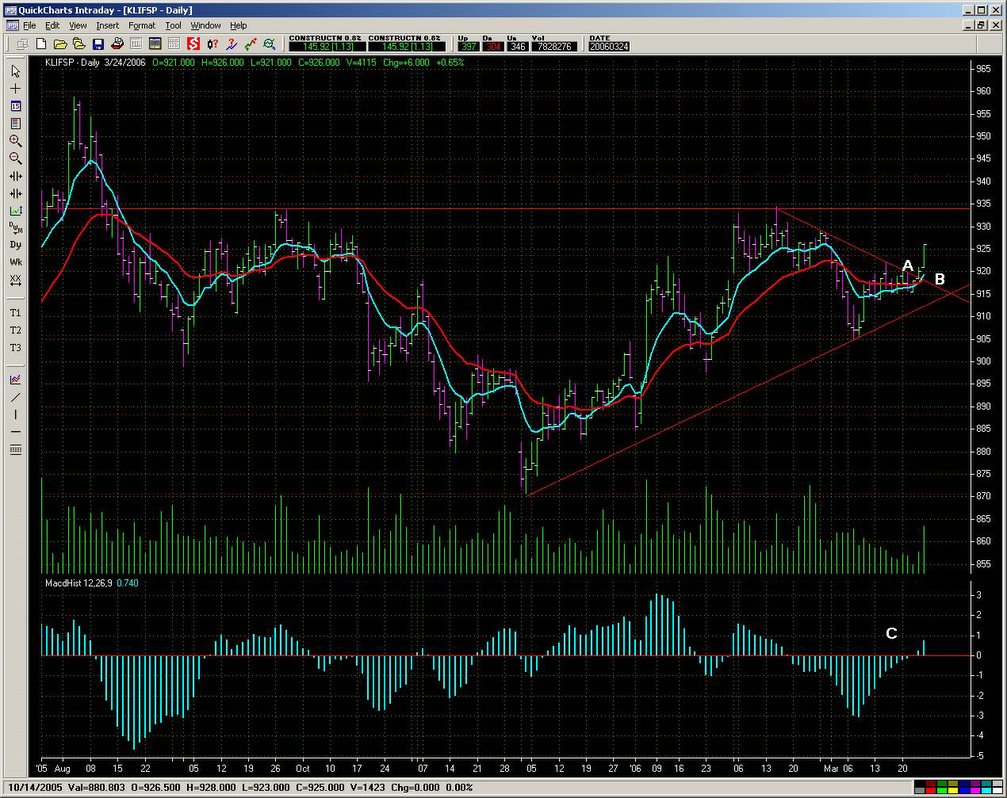 20060324 FKLI closes 926, well on the way to the breakout and maybe targeting 930 the resitance level. Reviewing a little on what factors put a good case for long trade: A Symmetrical triangle breakout B Moving avg crossover-path of least reisistance is up C MACD histogram momentum positive.
posted by emacro @ 11:15 AM
0 comments
![]()
![]()
 20060324 10:45 am. FKLI broke upwards out of the consolidation range. If KLCI cash can maintain gains to the close, we might have MACD confirmation on cash index upside breakout.
posted by emacro @ 10:54 AM
0 comments
![]()
![]()

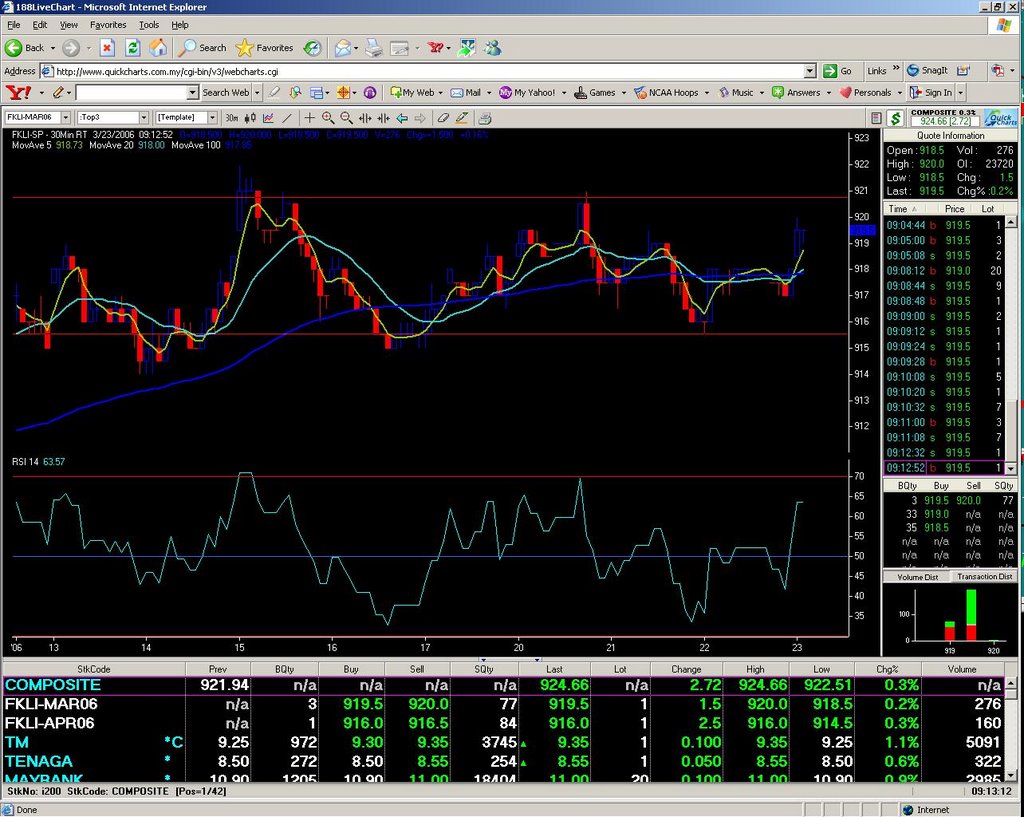 20060323 Few points of note. Daily FKLI breaks out f symmetrical triangle, an the market has been rangebound.(building up energy)
posted by emacro @ 11:31 AM
0 comments
![]()
![]()
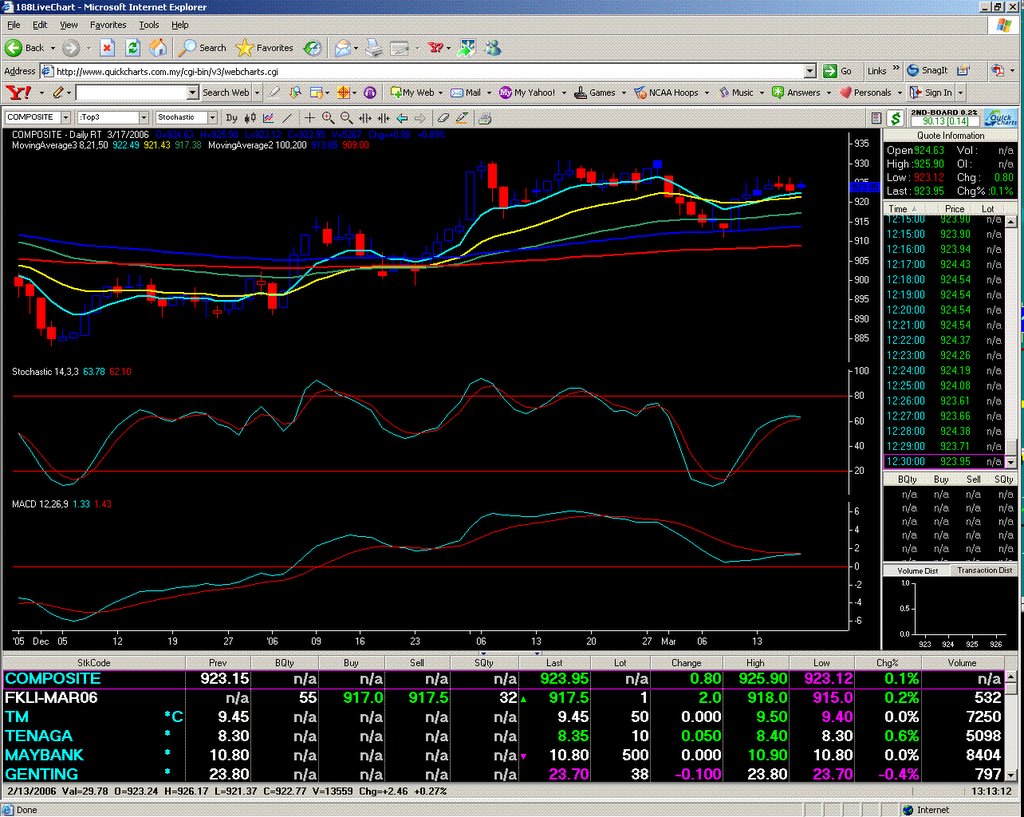 20060317 Lunch session break. KLCI cash trapped at support levels. However might turn uptrend, with stochastics unable to break down and MACD poised to confirm uptrend.
posted by emacro @ 1:17 PM
0 comments
![]()
![]()
 20060314 3:52 pm. Daily timeframe cash KLCI chart provided some clues to future bullish direction.
posted by emacro @ 11:36 PM
0 comments
![]()
![]()
 20060309 e:38 pm. the breakout bar (see rectangle area) came on the gap up bar today. Symmetrical triangles, or consoidation patterns can sometimes be a clue to what is about to unfold. The key is patience, unlike yesterday where we tried to force shorter trendline breakout, which in the end did eventually work. Let's review what made the odds in this trade: 1) A period of consolidation in triangle/wedge (building up energy) 2) RSI momentum above 50 and strong and 3) This morning the Japanese Nikkei 225 futures had a strong parabolic run up. (normally this is extraneous, but toda was a strong enough supporting factor)
posted by emacro @ 3:36 PM
0 comments
![]()
![]()
 20060308 4:35 pm. FKLI 30 min chart shows consolidation within triangle. Would look for break out either side.
posted by emacro @ 4:39 PM
0 comments
![]()
![]()
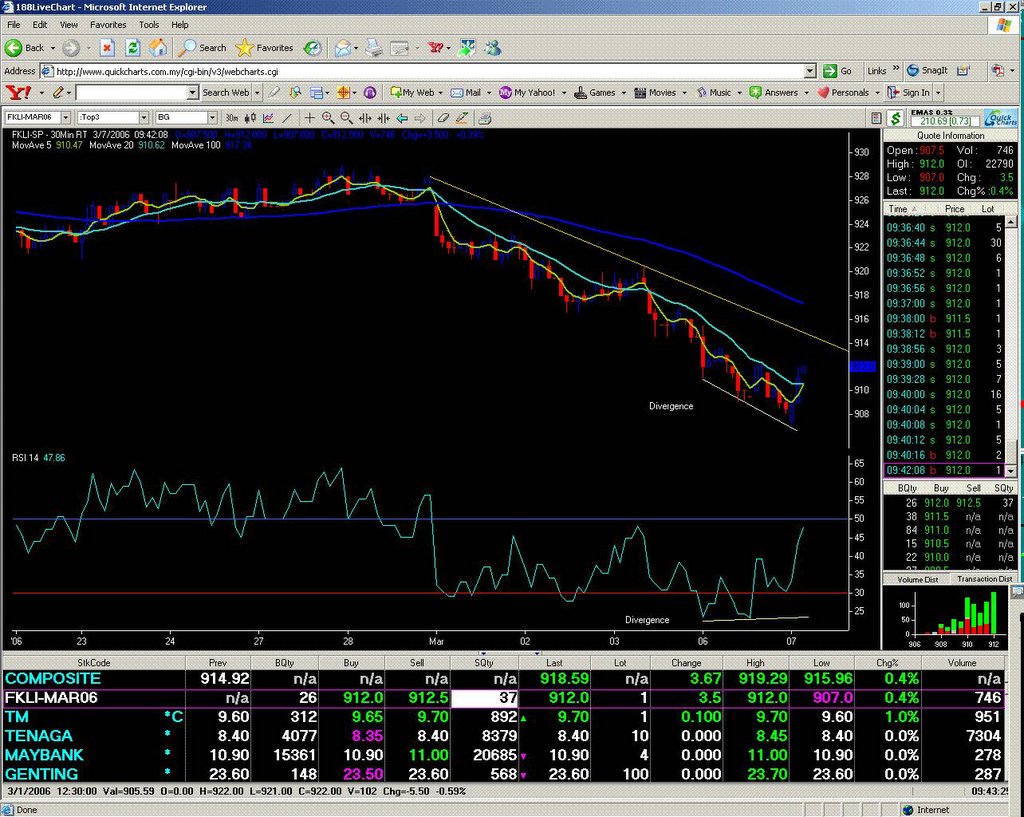 20060307 9:43 am. The pattern did materialise as a form of divergence, however volume traded at the lows was very thin, making this bounce trade difficult to execute.
posted by emacro @ 9:49 AM
0 comments
![]()
![]()
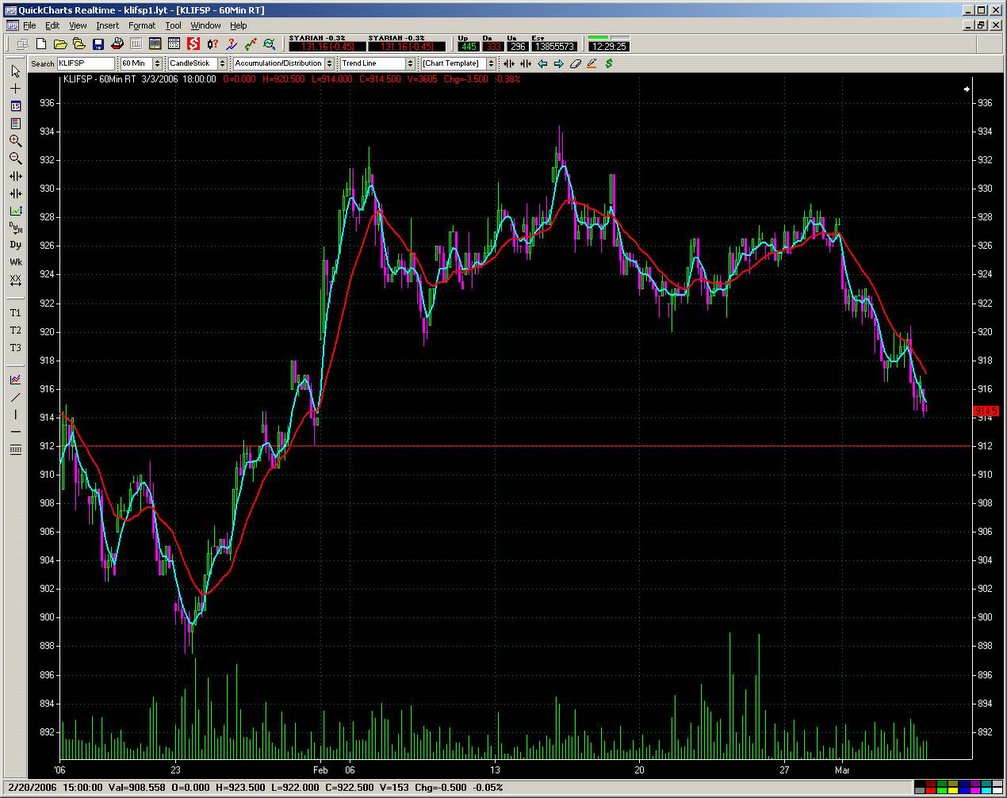 20060303 60 min chart of spot FKLI. Convey some important pieces of information for a possible capitulation type trade, maybe for a bounce.
posted by emacro @ 12:37 PM
0 comments
![]()
![]()
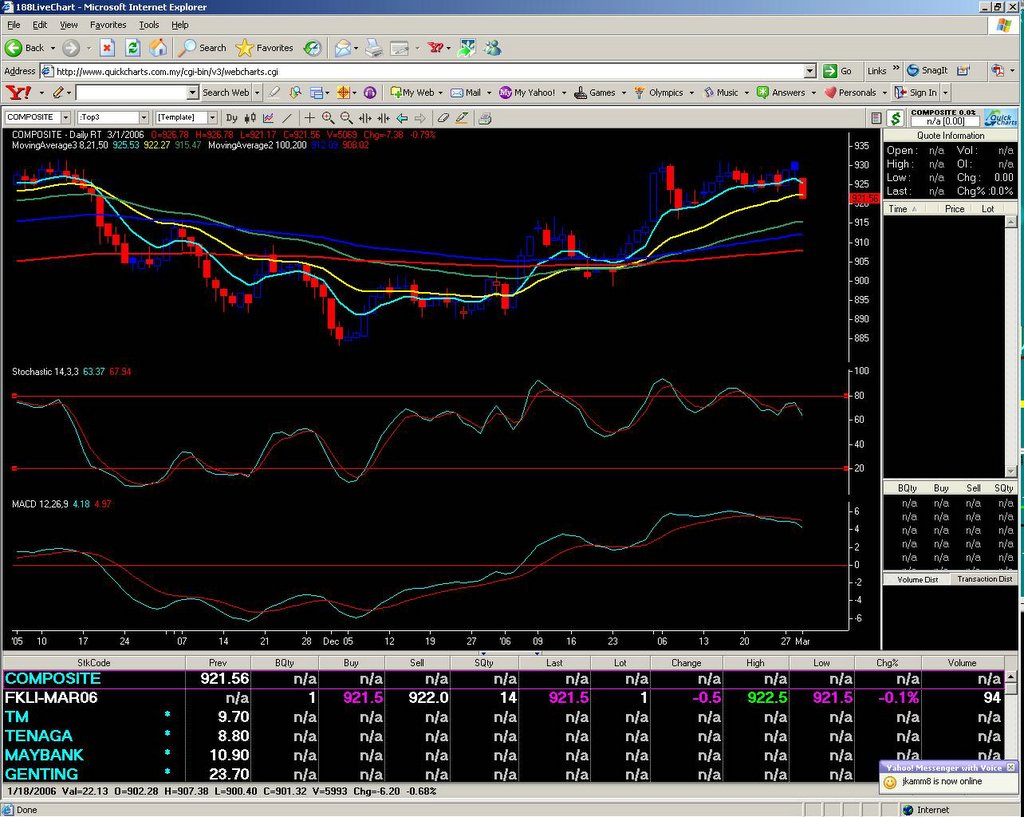
 20060303 Close. Daily FKLI chart shows classic Head & Shoulders pattern that broke the neckline 2 March. In hindsight it is always easy to identify this reversal pattern, the trick is to recognise it in real time trading. The normal target would be to project the height of the head down, which would be 934 - 920=14 FKLI points. Target should be around 905-906.
posted by emacro @ 7:01 PM
0 comments
![]()
![]()
 20060303 Bear flags and pennants in the downtrend. Of note is the RSI which consistently stays below 50.
posted by emacro @ 2:45 PM
0 comments
![]()
![]()
 20060302 12:13 pm. The previous "picture tells a thousand words" chart of the cash index is borne out in the down move in FKLI. The cash KLCI chart showed both indicators pointing down, with price downmove confirmation, 3 factors that support the short bias.
posted by emacro @ 12:17 PM
0 comments
![]()
![]()
 20060302 8:51 am. Cash KLCI chart: A picture is worth a thusand words.
posted by emacro @ 8:55 AM
0 comments
![]()
![]()