Thursday, September 29, 2005


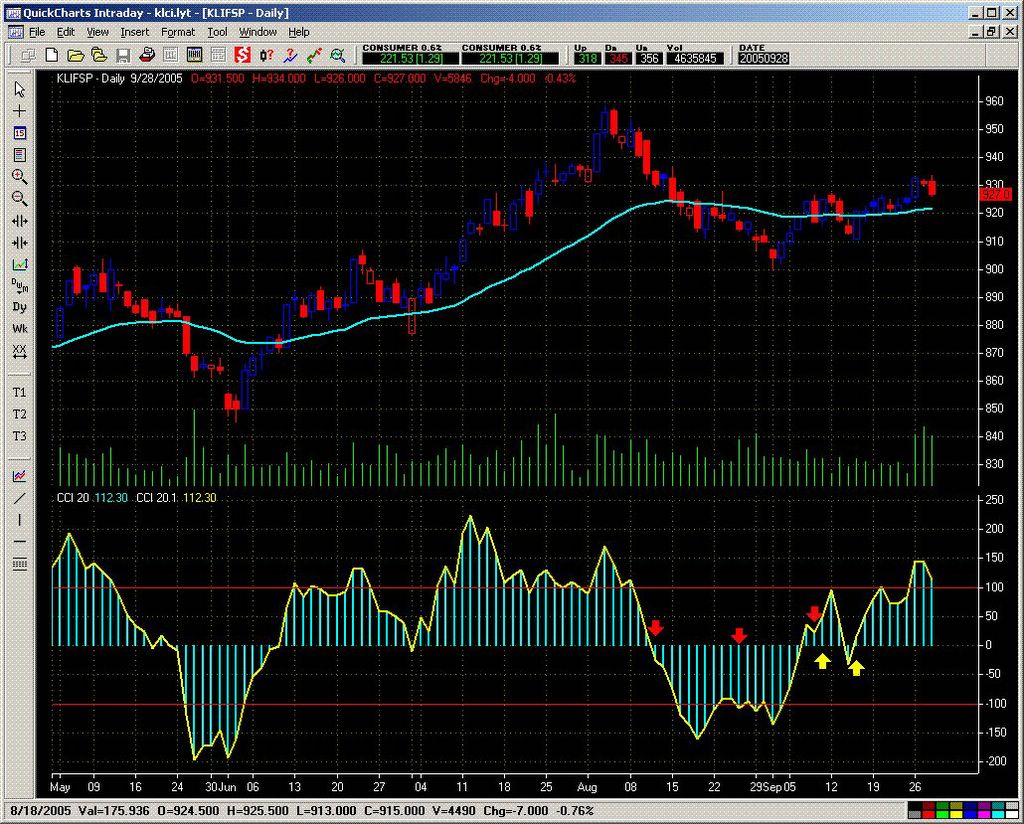
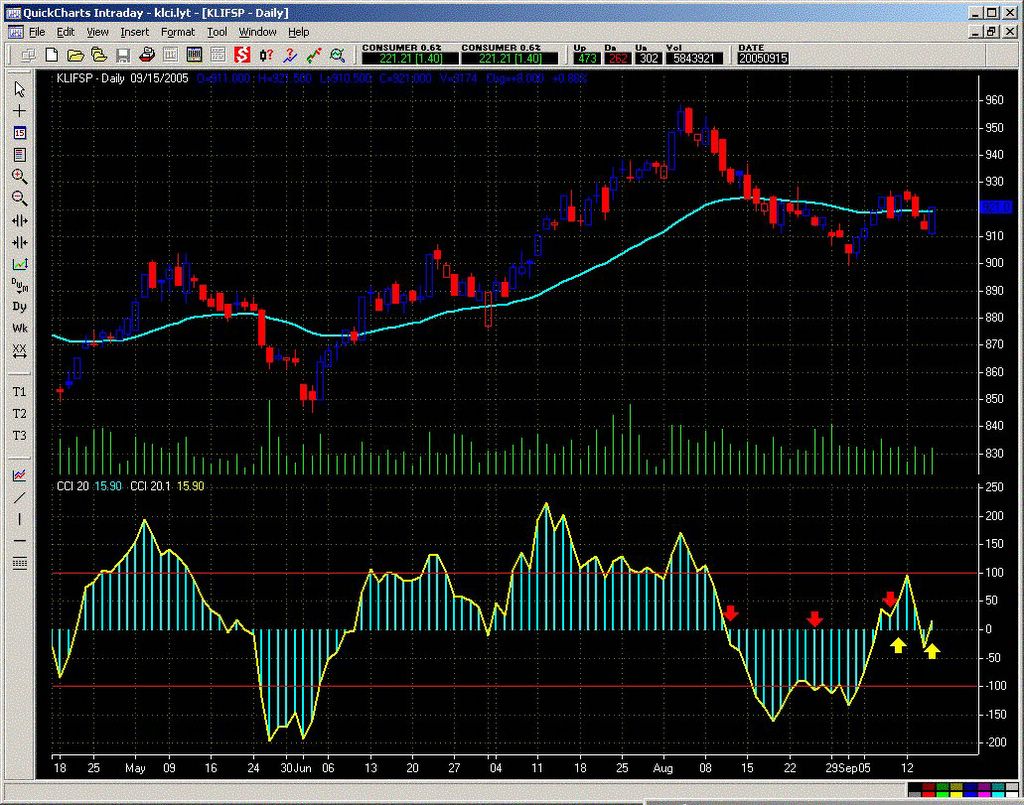
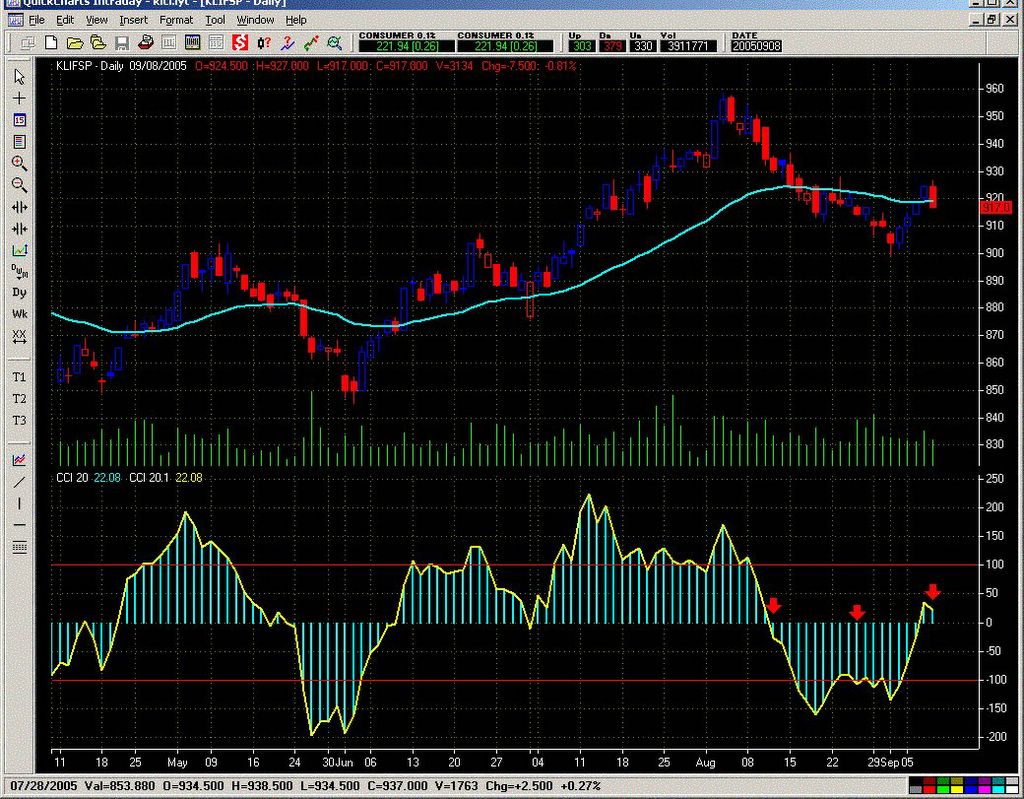
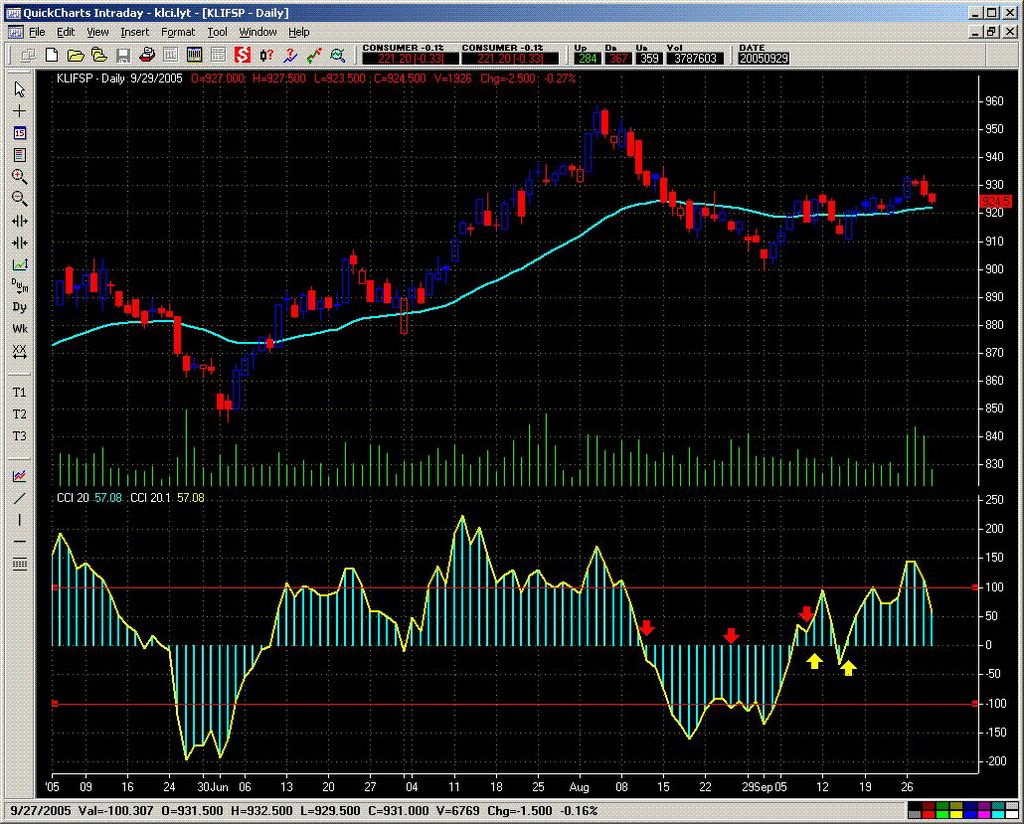
20050929 Another down candlestick, indicating selling interest. However fkli is pulling back to the area of the 34 ema, providing a possible buy point for continuatin of this small uptrend in the FKLI. Posted by Picasa

Wednesday, September 28, 2005


20050928 A hook down in the CCI, indicates slowing of upside momentum, might be a good idea to lighten up on long position and take some profits. Chance might come to reenter near the 34 ema. Posted by Picasa

Monday, September 26, 2005


20050926 133 tick chart of FKLI shows uptrend as at the close. Posted by Picasa


20050926 Break out of the recent tight range with good CCI momentum. Be looking for dips to buy, maybe to the 5 ema on 60 min charts to climb aboard the uptrend for those who missed the buy signals.(yellow up arrows) Posted by Picasa

Thursday, September 22, 2005


20050921 Buy signals still in force. CCI momentum to upside (on balance) but is waning a little. Posted by Picasa

Wednesday, September 21, 2005


20050920 Posted by Picasa

Saturday, September 17, 2005


20050916 Closing sees CCI upside momentum intact, buy signals in force. Posted by Picasa

Friday, September 16, 2005


20050916 11:18 am. Posted by Picasa

Thursday, September 15, 2005


20050915 Big candlestick indicates buying interest, opening near lows and closing near highs. Would expect more gains tomorrow. Well, the 910 test below failed to materialise, so this is a good support level for the market. Some buying in blue chips seen today. Posted by Picasa


20050914 8:57 am. Broke through the bottom trend channel. Could be targeting lower levels below 910, with the moving average showing downtrend in progress. Posted by Picasa

Wednesday, September 14, 2005


20050913 Brke down with big selling candlestick, however is still within the big range. This morning gapped down to 915.50 with retracement to the bottom channel line now, could gear for more weakness ahead. Posted by Picasa

Tuesday, September 13, 2005


20050913 12:18 pm. FKLI rangebound scribing a big range. Needs to break either of the trend lines. Posted by Picasa

Friday, September 09, 2005


20050909 Strong finish, indicates buying of FKLI futures, after the low of 915.50 tested in the morning twice. Short position taken yesterday went into profit only 2.50 pts. Now indications from CCI are for long position, a double test of the zero line. Posted by Picasa


20050909 5:15 pm. Found support around 916-18 region, closed strongly. Posted by Picasa

Thursday, September 08, 2005


20050908 A sell signal today, on breaking the low of the high day yesterday. CCI hooks down indicating upside momentum slowing. If CCI can break down through the zero line, the short trade could turn out better. Posted by Picasa

Wednesday, September 07, 2005


20050906 Good movement up to test the moving average resistance as expected. Wall St had good showing the day after Labor Day in the US, which is seasonally a trait of the US indices. Expect some strength in the morning for FKLI. But would wait for blue chips here to exhibit some strength in buying then take a short for scalp trade. However this is a higher risk type trade and does not fit everybody's risk tolerance. Posted by Picasa

Monday, September 05, 2005


20050905 11:27 am. Continuing on the technical rebound after breakout of the downtrend resistance line. Posted by Picasa


20050902 Technical rebound for the day's trade. Moving average resistance at 920. Posted by Picasa

Thursday, September 01, 2005


20050901 With the expiration of August contract, trading September today. Tho contract gapped down on the continuous chart, forming a bearish candle, should see further downside tests tomorrow, but with oversold conditions not precluding a technical bounce. Posted by Picasa


"There is the plain fool who does the wrong thing at all times anywhere, but there is the Wall Street fool who thinks he must trade all the time."J Livermore Manchester City FCl Crude Palm Oil

fcpo.blogspot.com


From Dragons and Bulls by Stanley Kroll
Introduction and Foreword
The Importance of an Investment Strategy
5 The Art of War, by Sun Tau (circa 506 BC) and The Art of Trading Success (circa AD 1994)
That's the way you want to bet
Long-term v Short term trading
Technicals v Fundamentals
Perception v Reality
Part 1: Winners and Losers
Part 2: Winners and Losers
Sun Tzu: The Art of War
Those who tell don't know, those who know don't tell
Why there is no such thing as a "bad market"
The Secret to Trading Success
The Experts, do they know better?
Risk control and money management
Larry Hite: The Billion Dollar fund Manager
Systems Trading:Kroll's Suggested Method
Buy the Strength Sell the Weakness
Good advice
The 'good bets' business by Larry Hite
Don't lose your shirt
Ed Sykota's secret trend trading system