Friday, January 27, 2006

20060127 10:20 am. Update on the cash KLCI Andrew's pitchfork. Still headed to the middle prong line, but because the angle is steep, could be a tough ask. Let's see what happens. Posted by Picasa

Thursday, January 26, 2006

20050126 10:08 am. Geting Bhe, since the breakout in the beginning of the month, might finally continue upwards. Posted by Picasa

20060126 9:32 am. Cash KLCI index: the Andrew's pitchfork sees the KLCI trying for the middle pitchfork line. Posted by Picasa

Wednesday, January 25, 2006

A compelling case for a good year for Bursa equities

Just stumble on yet another case for bullish tone of the Bursa. We already know that the daily chart is in uptrend currently. (higher highs and higher lows) The article in the edgedaily.com adds yet another piece of the jigsaw.

20060125 9:21 am. Update on the Andrew's pitchfork formation the Cash KLCI is undergoing. According to the rules, we'd expect a target o the middle pitchfork line, so 920 is not out of the question in the coming days. Posted by Picasa

Tuesday, January 24, 2006

20060124 Close, cash KLCI index chart shows bullish stochastics and 2 breaks of downtrend lines. A third confirmatin from the MACD crosing up will confirm a longer term continuation buy signal for the FKLI. Posted by Picasa

20060123 Drawing some trendlines on the FKLI daily chart provides perspective on the prevailing trend. Posted by Picasa

Monday, January 23, 2006

20060123 2:42 pm. Sees FKLI indicators pointing down, however the pattern is still of higher highs and lows on the FKLI unless certain levels are broken and closed below, including the trendlines. Posted by Picasa

Friday, January 20, 2006

20060120 Weekly closing candlestick shows sellers. However the momentum oscillators show up on stochastics and MACD barely positive. On balance the trend should still be up. Posted by Picasa

20060120 11:43 am. What started out as a slow day with rollover picking up, sees a break down mid morning, potentially turning into a trend day down. Posted by Picasa

20060120 9:46 am. Cash CI index chart exhibit a triangle pattern. As of right now is showing breakout, but will have to wait till end of the day to complete the candlestick to confirm. Posted by Picasa

Thursday, January 19, 2006

20060119 3:30 pm. FKLI quiet despite the volatility in regional markets. Let's take the time to examine how the previous trade long, can be entered with more certainty and confidence. The 60 min chart of the FKLI shows the 200 ema was tested yesterday, held the support. So we know there is another factor that improves the probable outcome of the trade. Posted by Picasa

20060119 12:14 pm. Gaps up, breaks the trend line and proceeds to the 2nd trendline target. Posted by Picasa

Wednesday, January 18, 2006

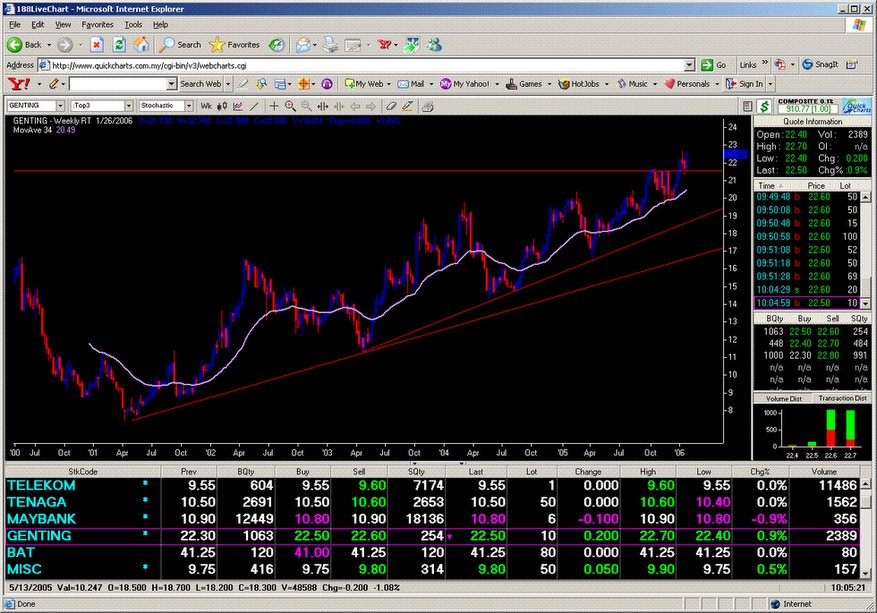
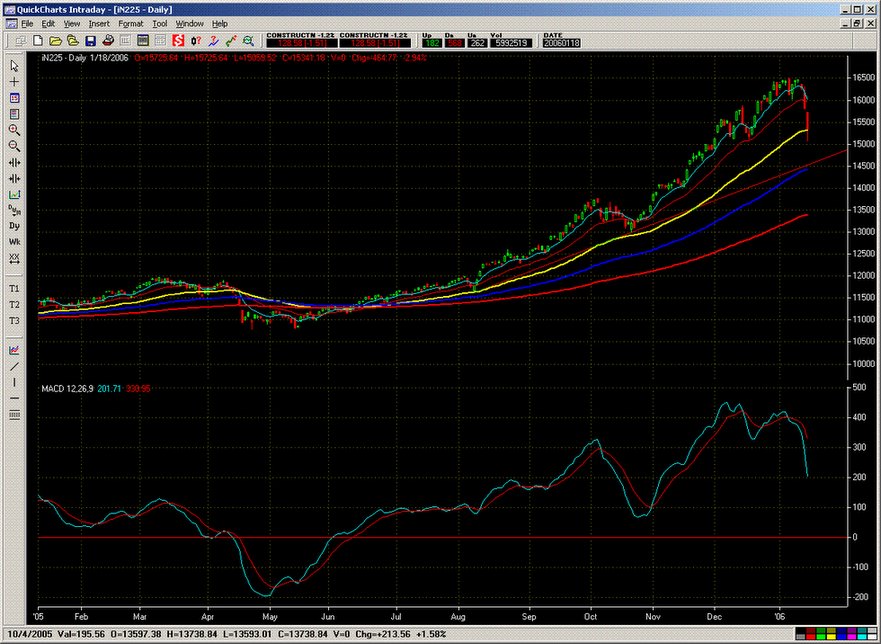
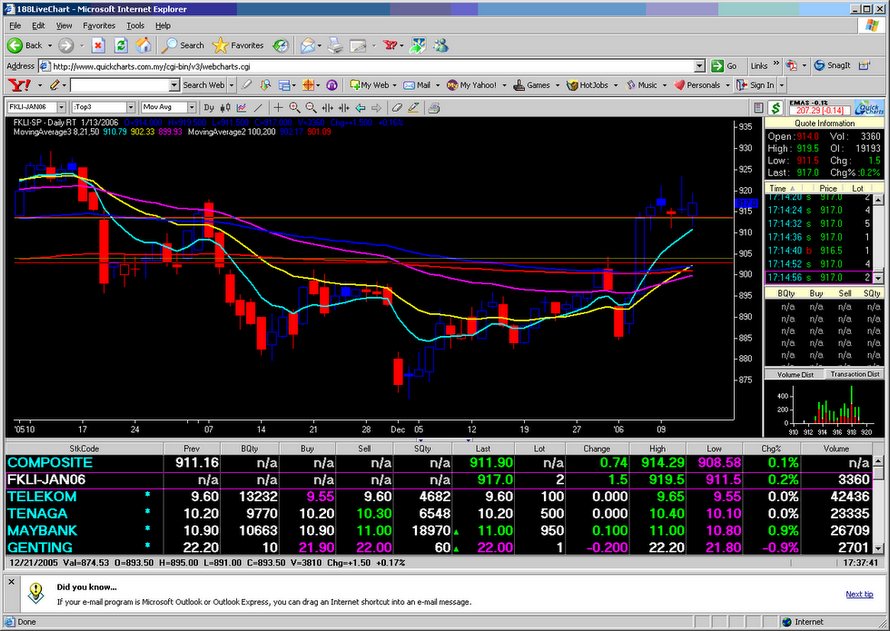
20060118 Nikkei 225 Stock Average, the last 2 day plunge. Is this smething new? Something disastrous? The end of the world? As it stands, we see this all the time in specific stock charts. For example on Bursamalaysia names that come to mind include Liqua, Tanamas, Gensoil, Ho Wah Genting, Abric, go way back the 2nd Board companies like Posim, Repco, Hwa Tai, etc etc the list goes on and on. Right now there is one such pattern on a stock starting with F, which has a very bullish broker call on it at the moment. The bottom line is when large funds (or syndicates) push up the stock, they create excitement and pandemonium and prey on human greed, and when they liquidate the positions, the unsuspecting small investor/trader often gets burnt. The Nikkei 225 plunge is no different, a chart is a chart, only this one is a much bigger scale.
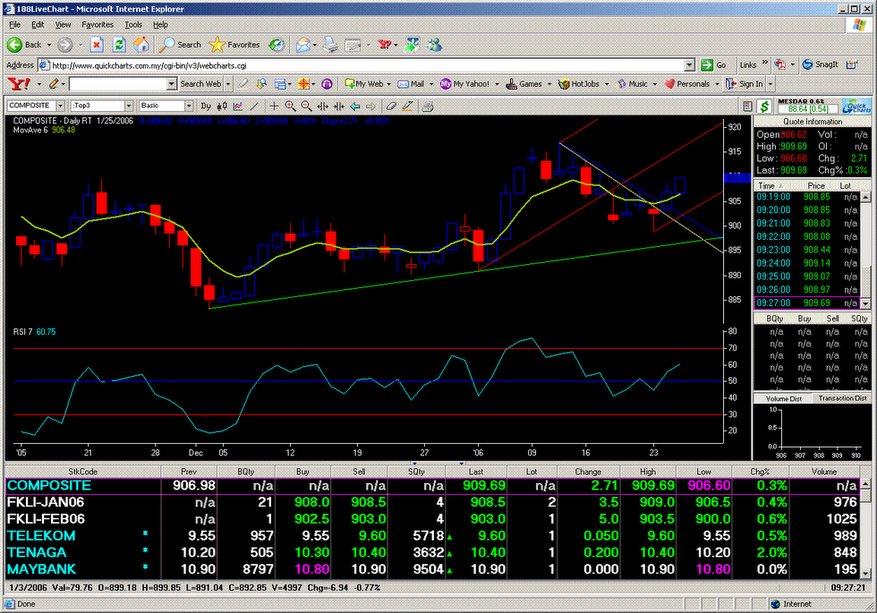
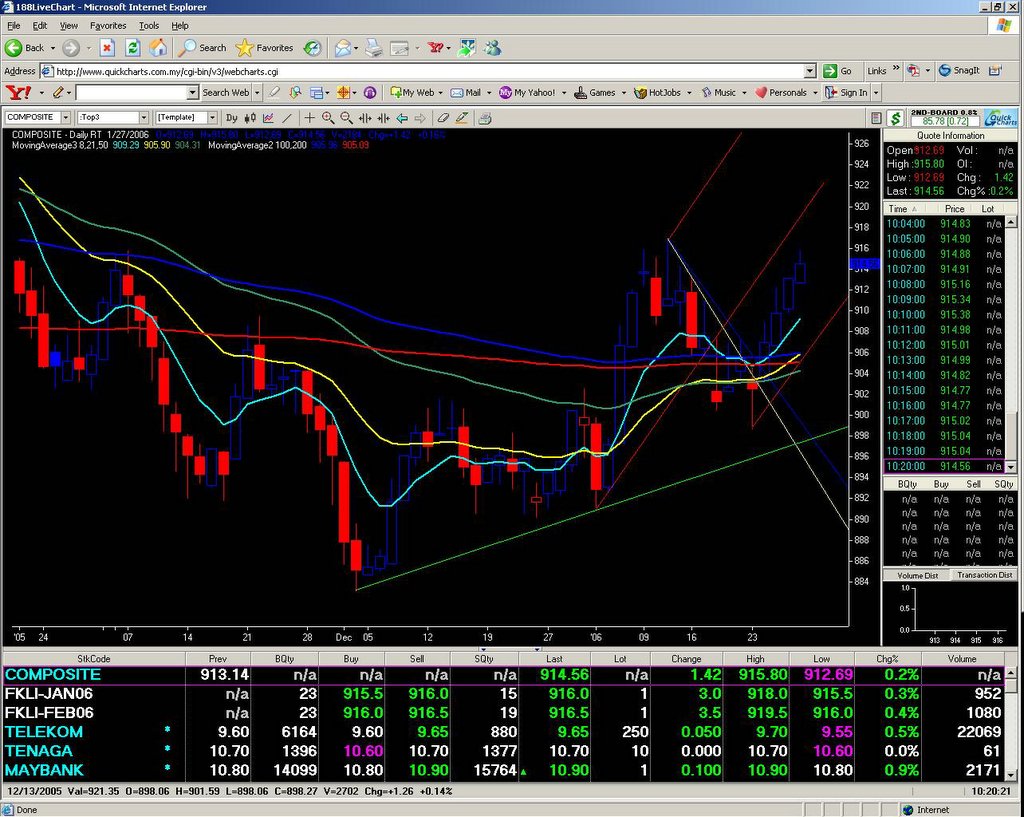
 Posted by Picasa

20060118 Close. The FKLI and Bursa in general is afected by the turmoil in the Nikkei 225 drop of greater than 8% in 2 days. Overnight news of earnings misses also has a bearing on the market. The divergence gap closing trade did not materialise due to no close above the resistance levels.(trend lines) A trade idea is the 3 step trend line reversal, The chart shows 3 progressively steeper resistance trendlines. Tomorrow if can get a close above the last trendine, a long signal would trigger, with the target of the 2nd, then the 3rd trendline. Posted by Picasa

Tuesday, January 17, 2006

20060117 4:25 pm. Stopped out of thelong positin by the adverse movement due to the Nikkei 225 plunge, caused by the Livedoor issue. Two things are evident from the 45 min chart here, a divergence is possibly forming and there is an upside gap caused by the sudden selldown after lunch. Watching these for possible trade. Posted by Picasa

20060117 Lunch session close. So the long position went underwater early morning, now looks ok. The 2 out of 3 factors supporting the trade helped. In addition the longs were established at moving average support (see chart) and with CCI still maintaining above the zero line had momentum upside. Posted by Picasa

Monday, January 16, 2006

20060116 The 60 min chart pattern is the thing against the long position, showing a break of a triangle pattern. However, daily charts show support from 50,100 and 200 ema at aroun 905 level. We have 2 factors for the trade, underlying support on daily chart and 15 min, but a triangle pattern break. Odds favour the long side. Posted by Picasa

20060116 Closing the FKLI settled right at around its 15 min 200 ema, which provide support. Will the market break lower? or provide a meaningful bounce to get out of a long position around 912 that we got today? Posted by Picasa

20060116 An instructive chart pattern that appeared last month. This is a Head and Shoulders pattern that usually is a trend reversal pattern. Posted by Picasa

20060116 10:51 am. Silverbird, is almost to the first target (2nd trend line) Posted by Picasa

Sunday, January 15, 2006

20060113 Weekly closing. The big picture is that stochastics has come off some overbought levels, momentum still remains strong with MACD bullish, so looks like the FKLI may be set to continue the bullish move up in the coming weeks. Posted by Picasa

Friday, January 13, 2006

20060113 Close. FKLI has downside support from the 8 ema and the horizontal symmetry level, preventing the downside test going far. So should still maintain bullish stance. Posted by Picasa


20060113 Close. FKLI has downside support from the 8 ema and the horizontal symmetry level, preventing the downside test going far. So should still maintain bullish stance. Posted by Picasa

20060113 Close. Proton had a big gap down today in response to the Volkswagen statement of tie up talks being called off. The old trendline which provided the impetus of the reversal trade, proved to be good support again. Posted by Picasa

20060113 8:56 am. FKLI gaps down in reaction to weakness on Wall St after hefty 7 straight sessions of gains. On the daily FKLI chart we have some mov avg support levels downside, possible buy entries for those who believe the bull is not over, including us. Posted by Picasa


"There is the plain fool who does the wrong thing at all times anywhere, but there is the Wall Street fool who thinks he must trade all the time."J Livermore Manchester City FCl Crude Palm Oil

fcpo.blogspot.com


From Dragons and Bulls by Stanley Kroll
Introduction and Foreword
The Importance of an Investment Strategy
5 The Art of War, by Sun Tau (circa 506 BC) and The Art of Trading Success (circa AD 1994)
That's the way you want to bet
Long-term v Short term trading
Technicals v Fundamentals
Perception v Reality
Part 1: Winners and Losers
Part 2: Winners and Losers
Sun Tzu: The Art of War
Those who tell don't know, those who know don't tell
Why there is no such thing as a "bad market"
The Secret to Trading Success
The Experts, do they know better?
Risk control and money management
Larry Hite: The Billion Dollar fund Manager
Systems Trading:Kroll's Suggested Method
Buy the Strength Sell the Weakness
Good advice
The 'good bets' business by Larry Hite
Don't lose your shirt
Ed Sykota's secret trend trading system