
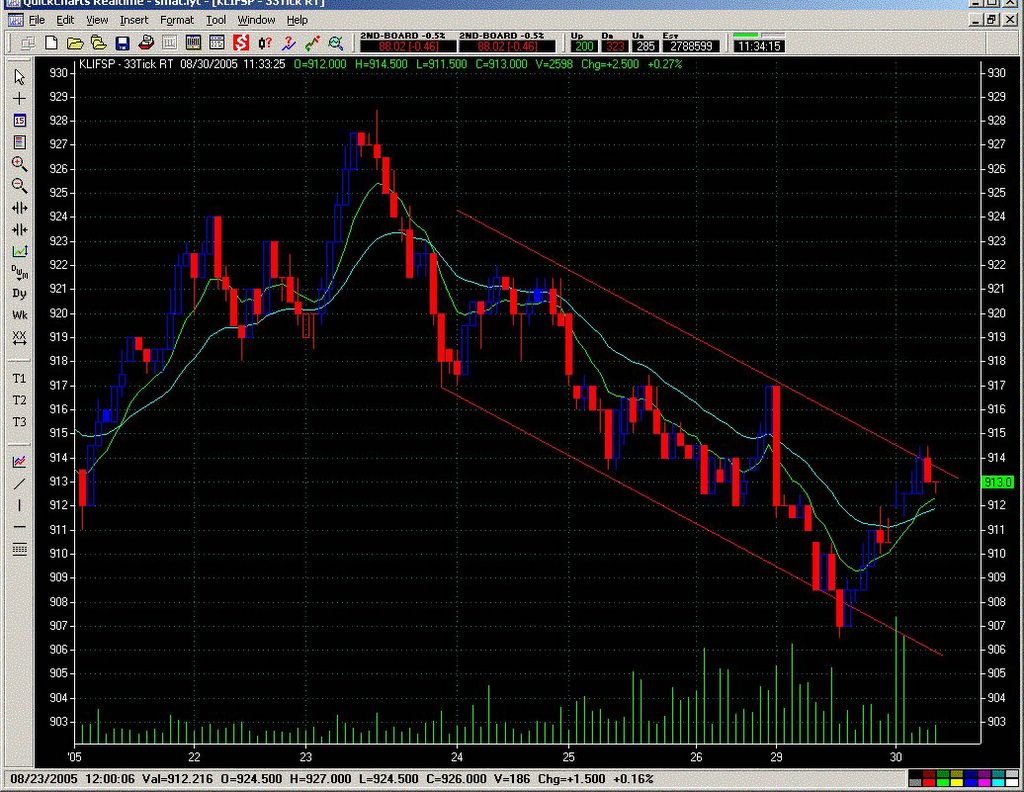
20050830 Closing and final settlement day for FKLI August contract.

posted by emacro @ 5:27 PM
0 comments
![]()
![]()
This will chronicle trading in the FKLI & FCPO futures. If you don't like what you see/read in this blog, just surf away. These opinions are our personal opinions and just a record of our thoughts..."In evolution, it’s not the biggest, the fiercest nor the smartest that survive, it’s the one that changes the fastest.” I.e. the key word is to adapt the trading style to the markets, until it stops working
posted by emacro @ 5:27 PM
0 comments
![]()
![]()
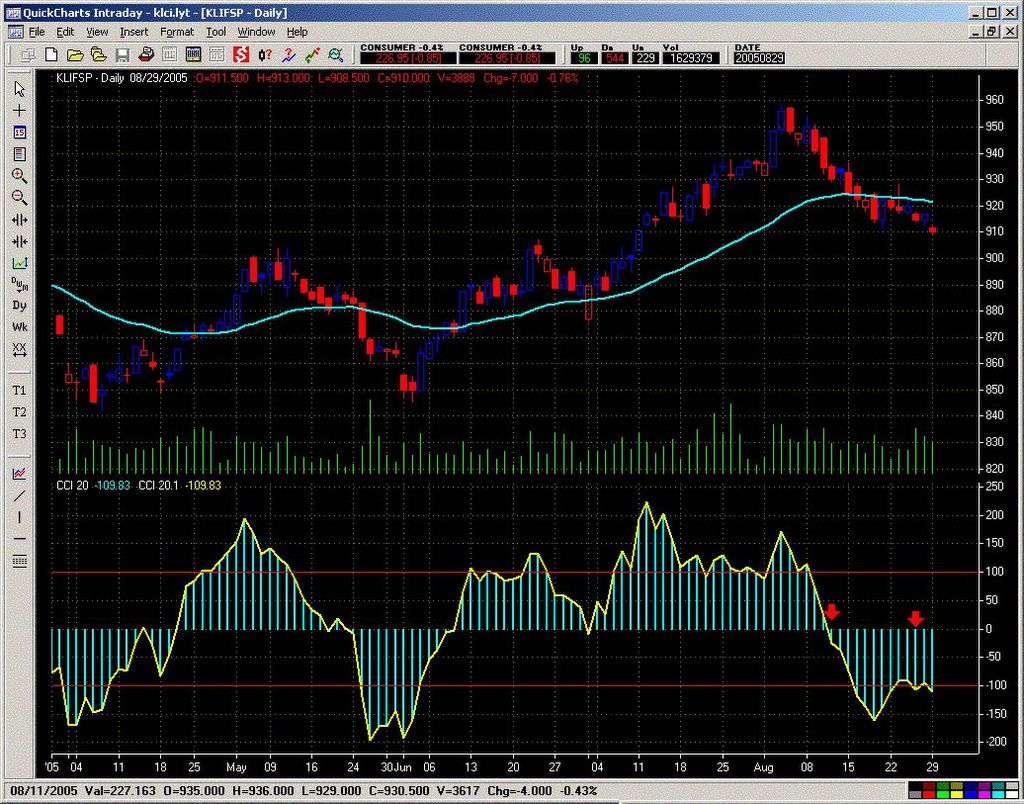
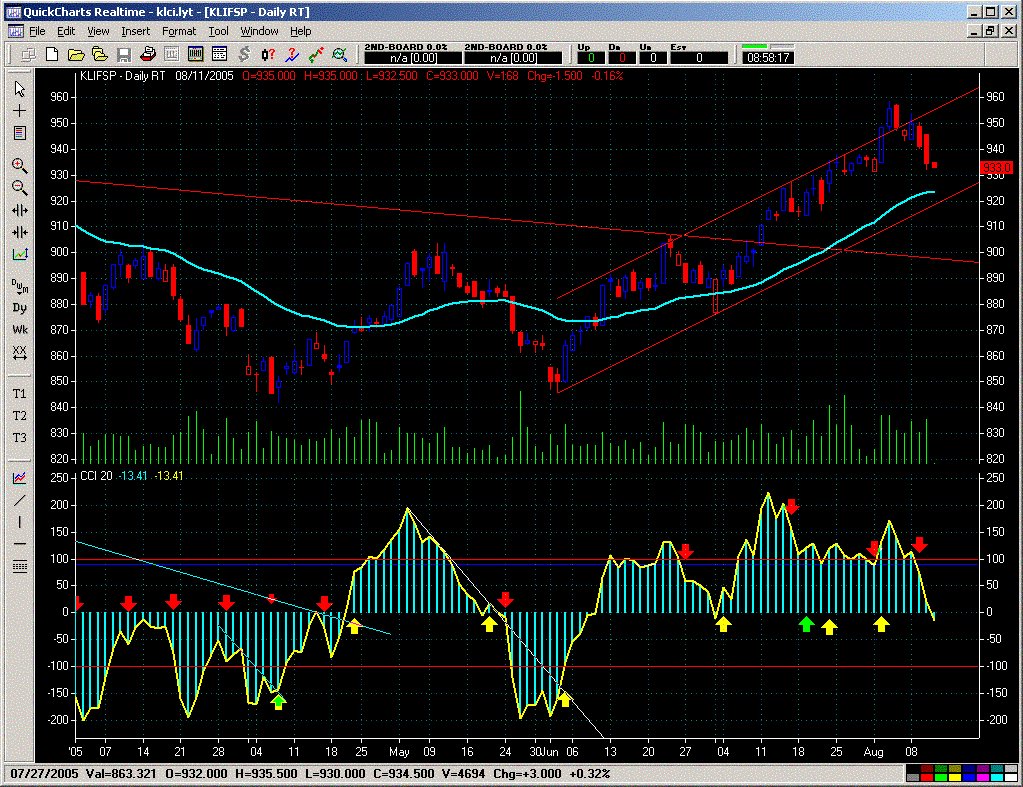
20050829 Closing candlestick indicates some buying support. CCI still shows downward momentum is dominant. Might be a technical rebound coming though.

posted by emacro @ 11:41 PM
0 comments
![]()
![]()
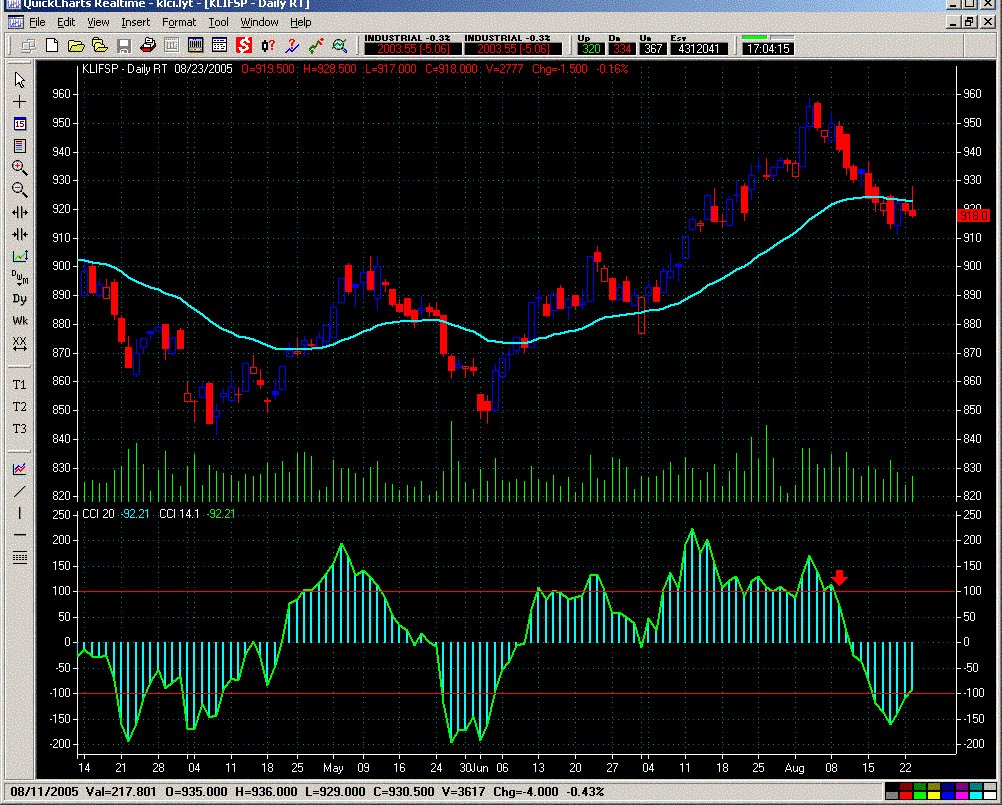
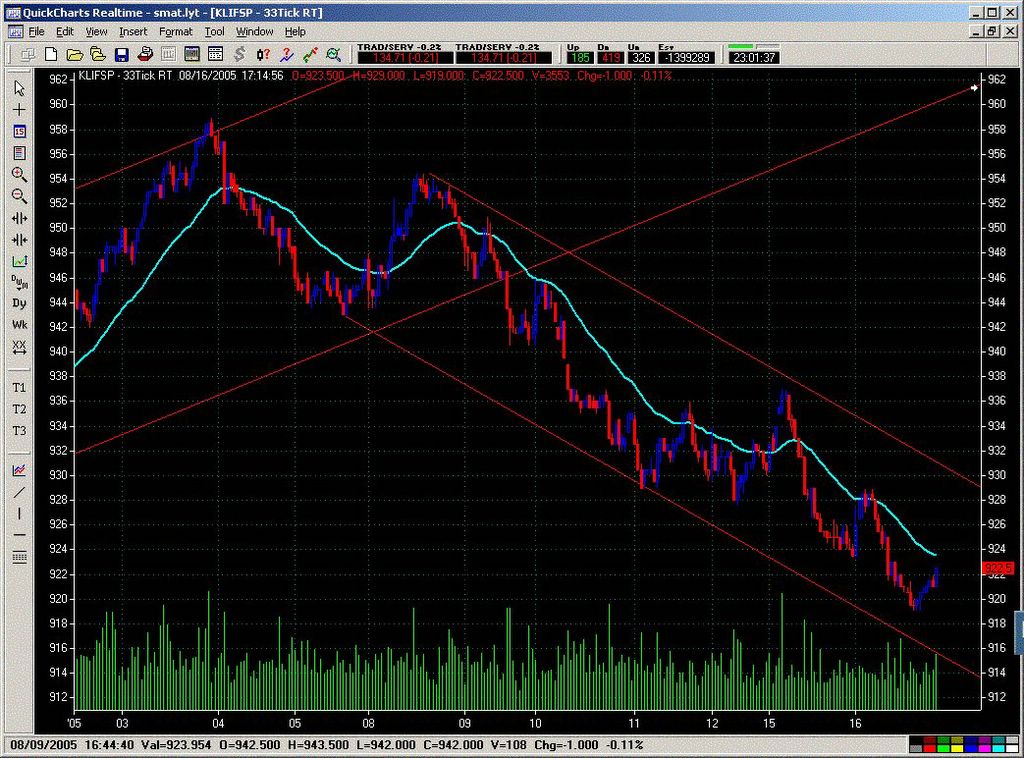
20050829 Lunch session break. FKLI gapped down this morning and sold off into lunch close. The crude oil price hit above US70 per barrel, sending shockwaves into stock indices across Asia, so there was not hte expected strength in FKLI. But the sell signal (red arrow) on last Thursday close is still in play, with CCI momentum still pointing down after a pause. One thing is clear, the spike up in the FKLI after the cash closed was a short squeeze and non sustainable, it is now clear.
posted by emacro @ 1:56 PM
0 comments
![]()
![]()
posted by emacro @ 2:27 PM
0 comments
![]()
![]()
posted by emacro @ 5:30 PM
0 comments
![]()
![]()
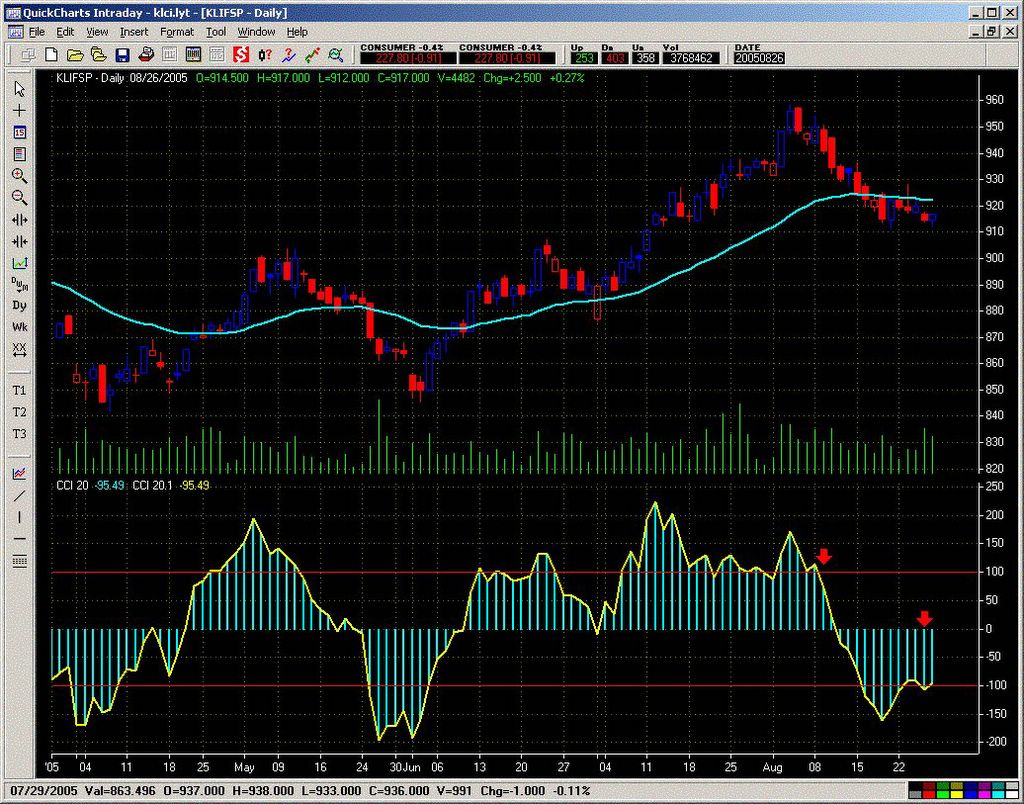
20050823 Closing. The strong buying into the lunch time close petered out. So most likely that was the technical rebound most had expected. Candlestick is bearish, shows that bulls were beaten back by the bears to close near lows. Expect more downside, at least for the morning session tomorrow.
posted by emacro @ 5:25 PM
0 comments
![]()
![]()
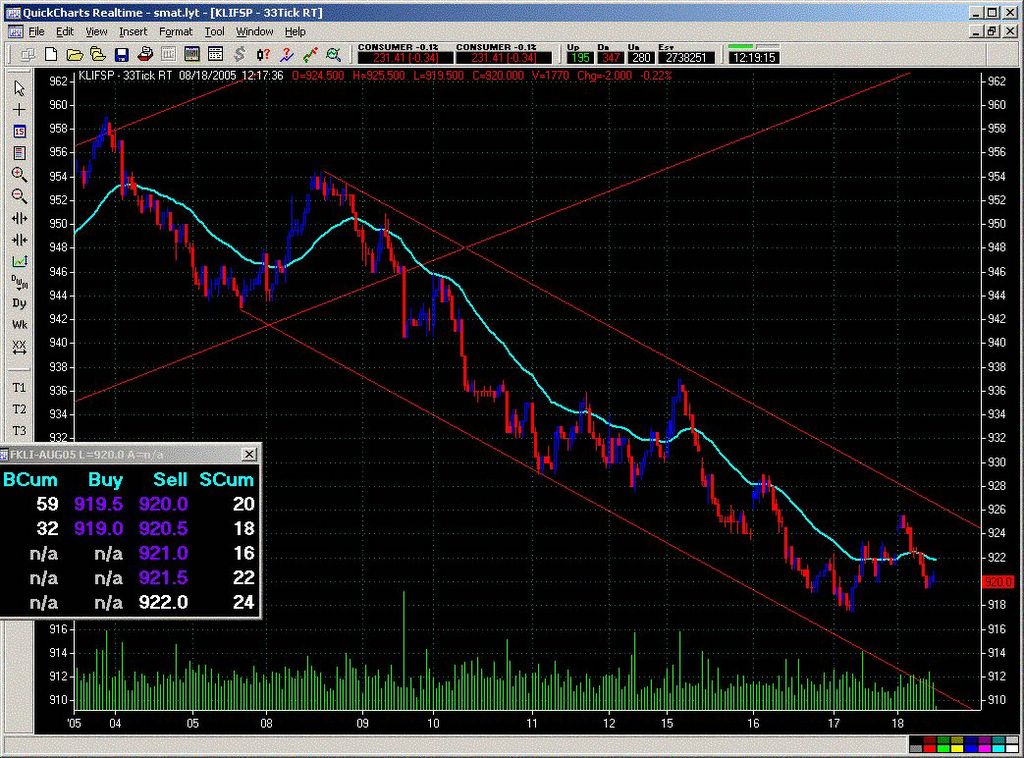
20050818 12:20 pm. This is an updated chart. Seems the previous post chart had been corrupted and was inaccurate.
posted by emacro @ 12:23 PM
0 comments
![]()
![]()
20050818 9:03 am. The tradable bounce yielded a good move up. Now at the resistance upper channel line, moment of truth as to whether can go through.

posted by emacro @ 9:06 AM
3 comments
![]()
![]()
20050816 Big candlestick indicates selling. CCI crossing below 3 days ago was a sign of breaking majo support at that time. Price now resting on the moving verage. I think there could be a tradable bounce for long trade tomorrow.

posted by emacro @ 11:13 PM
0 comments
![]()
![]()
20050812 Testing the channel line support. Candle today shows some buying support, with FKLI unable to hld the lows below 930. Be watching CCI for a hook up for the next possible trade after the ghost short.(arrow)
posted by emacro @ 12:43 PM
0 comments
![]()
![]()
20050811 Two days after the ghost sell signal, continuing downside seen. CCI breaking zero indicates sigificant support could have been broken.

posted by emacro @ 8:36 AM
0 comments
![]()
![]()
Trading with the Trend. A lot can be said about trading the prevailing trend, but as they say, a picture is worth a thusand words.

posted by emacro @ 2:33 PM
0 comments
![]()
![]()
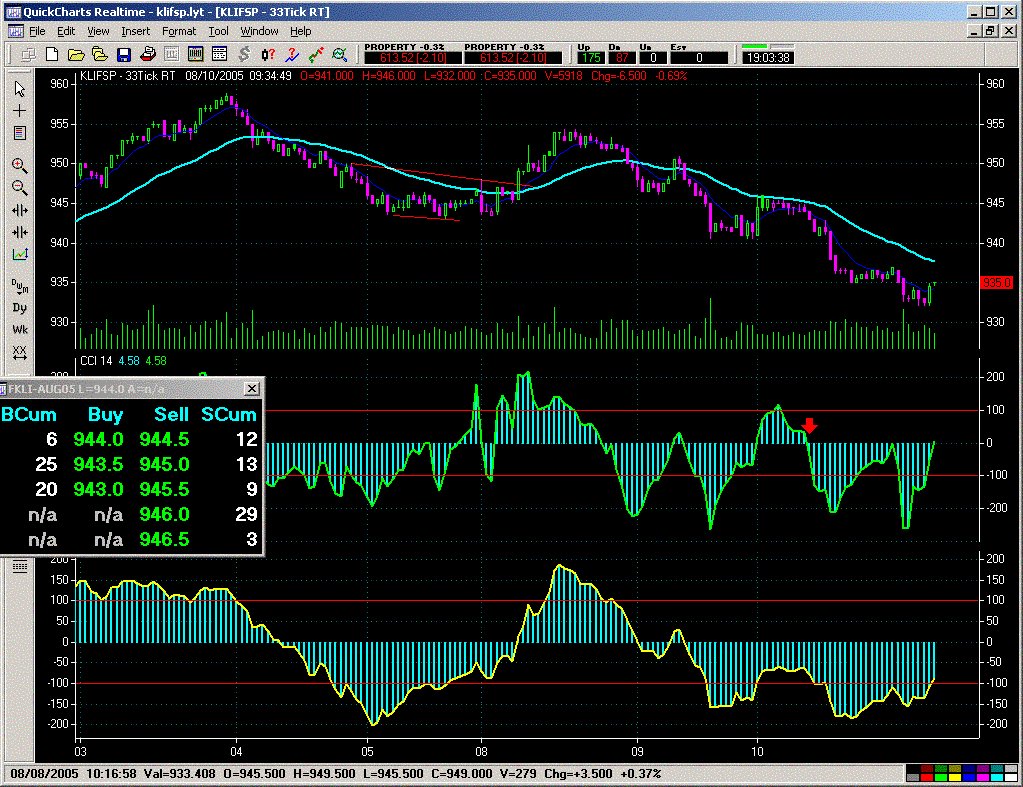
20050810 Closing. Looking for shot was a good strategy, possible entry point is the arrow shown on the 14cci crossing below zero.
posted by emacro @ 7:16 PM
0 comments
![]()
![]()
20050809 8:52 am. Looks like a 'ghost' pattern short on yesterday's close. Market opened up higher today 946. Could be opportunity to look for short trade.

posted by emacro @ 8:55 AM
0 comments
![]()
![]()
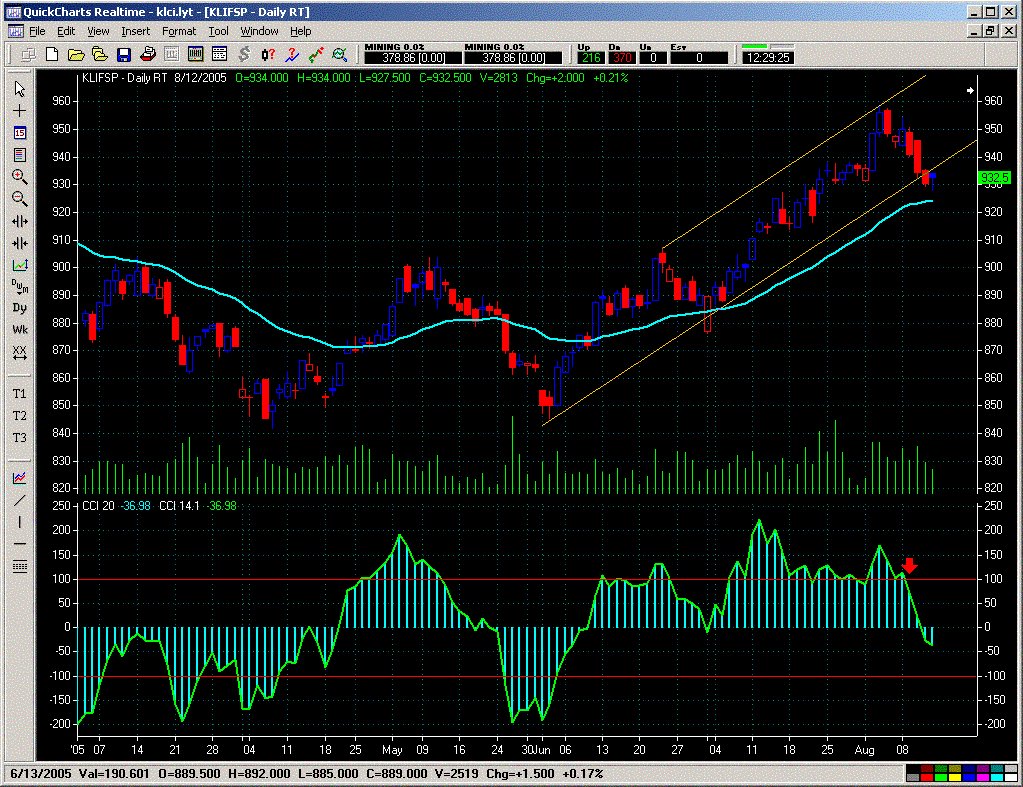
20050808 Candlestick today looks like indicative of buying interest. Opens near the low and closes above the midpoint. CCI rejects +100 which is a buy signal (aggressive). The trend channels delineate the uptrend of the past few months.

posted by emacro @ 5:34 PM
0 comments
![]()
![]()
20050808 11:58 am. The crossing of the 50cci above the zero line provided a good scalp trade long.

posted by emacro @ 12:00 PM
0 comments
![]()
![]()


