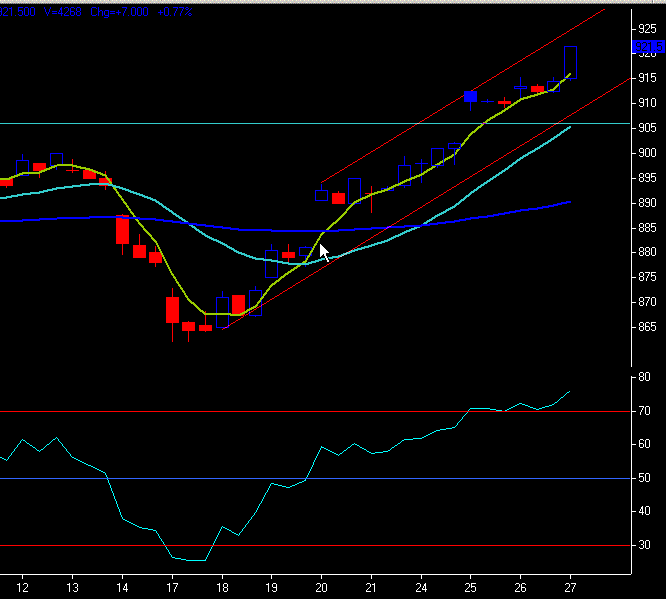
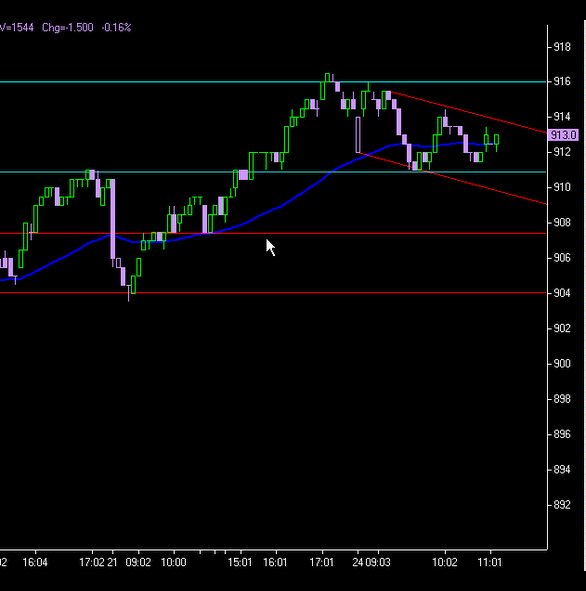
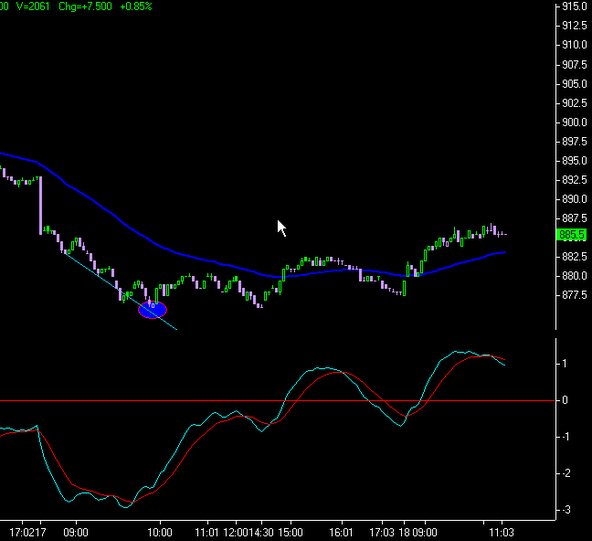
 20060727 11:08 am. Uptrend continues.
posted by emacro @ 11:23 AM
0 comments
![]()
![]()
This will chronicle trading in the FKLI & FCPO futures. If you don't like what you see/read in this blog, just surf away. These opinions are our personal opinions and just a record of our thoughts..."In evolution, it’s not the biggest, the fiercest nor the smartest that survive, it’s the one that changes the fastest.” I.e. the key word is to adapt the trading style to the markets, until it stops working
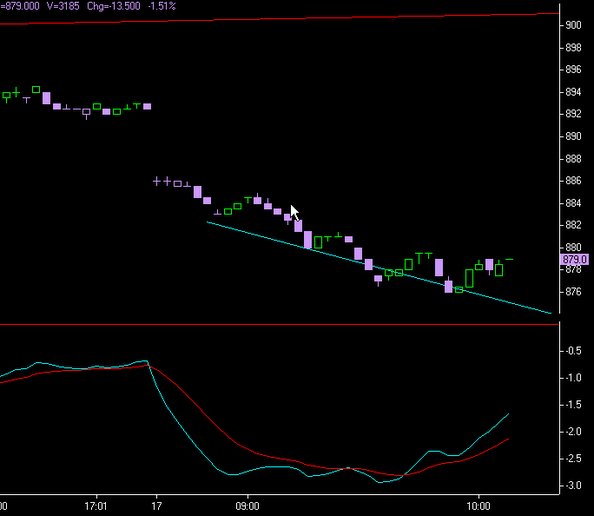
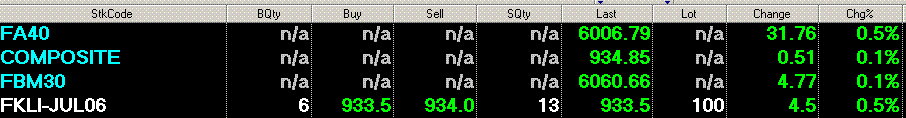 20060727 10:53 am. This is a familiar situation. We see the FTSE ASEAN 40 index +0.5%, while the KLCI and FBM30 only +0.1%. The Hang Seng and Nikkei 225 futures meanwhile are up >1%. Why is this always the case, where Malaysian indices ALWAYS buck the trend of regionals? The answer lies in the fact the capital controls made the malaysian stock market stand still for 7 years, resulting now in lack of foreign participation, would be my guess.
posted by emacro @ 10:59 AM
0 comments
![]()
![]()
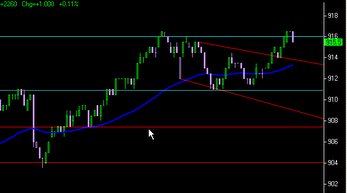
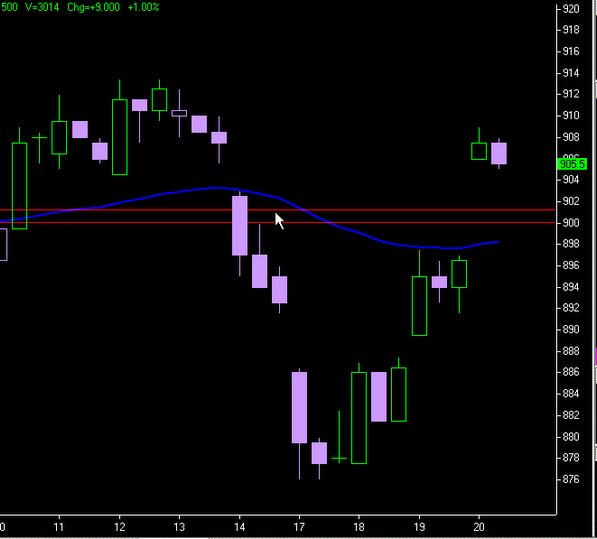
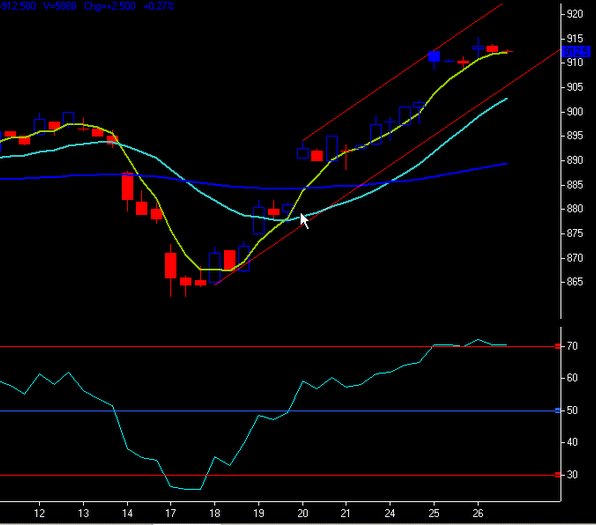 20060726 4:23 pm. FKLI Aug 06 contract shows well defined uptrend.
posted by emacro @ 4:33 PM
0 comments
![]()
![]()
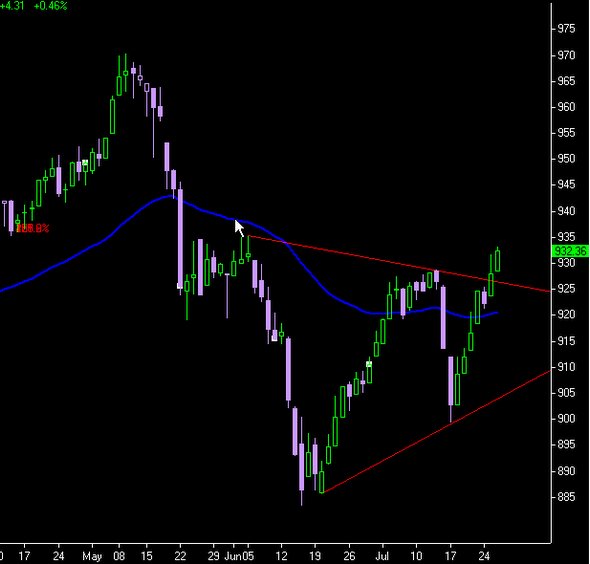 20060726 12:30 pm. At the lunch session, we can see the KLCI cash has broken out of the triangle formation a few days ago. This looks to be a bullish sign, may look to long pullbacks. If you look closely, the formation is an inverted Head and Shoulders reversal, a pattern which is particularly powerful, notwithstanding that the neckline is sloping down
posted by emacro @ 2:32 PM
0 comments
![]()
![]()
 20060724 11:12 am. 13 tick charts with the levels we are watching today.
posted by emacro @ 11:19 AM
0 comments
![]()
![]()
 20060721 12:15 pm. FKLI forms interesting channel on 13 tick chart. We may yet get the break down to the 900-901 level where longs are waiting.
posted by emacro @ 12:27 PM
0 comments
![]()
![]()
 20060720 12:31 pm. Given the impenting expiration of the July contract 1 week, the plan would to buy a 50-61.8% fill of today's gap, from 902 down, to hold for settlement. Let's see how this pans out.(chart is 120 min timeframe)
posted by emacro @ 12:46 PM
0 comments
![]()
![]()
 20060720 8:59 am. Gaps up on Wall St relief rally, caused by Ben Bernanke comments about "getting off the interest rate elevator soon". News aside, the pattern identified yesterday worked well.
posted by emacro @ 10:04 AM
0 comments
![]()
![]()
posted by emacro @ 9:16 AM
0 comments
![]()
![]()
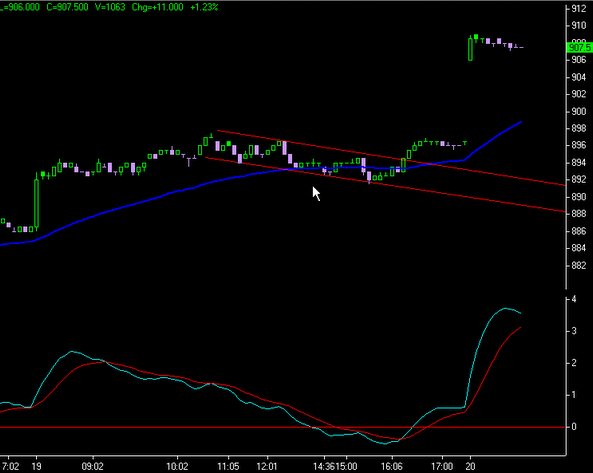
 20060718 11:15 am. Holding onto to the long from the buy signal (10:10 am 17 July) garnered some ticks.
posted by emacro @ 11:40 AM
0 comments
![]()
![]()
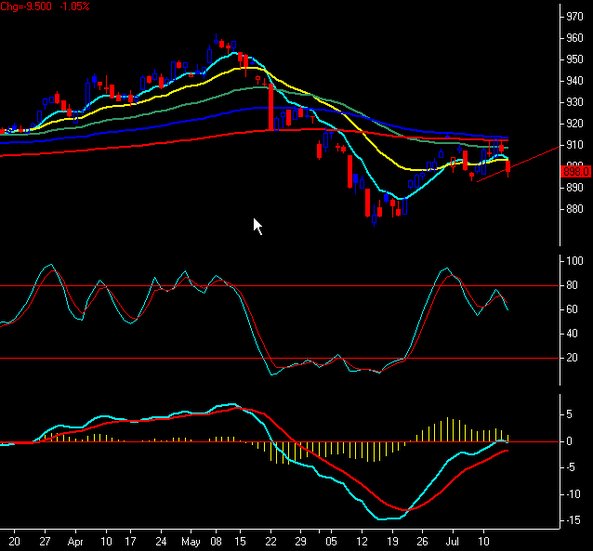
 20060717 5:15 pm. FKLI daily chart, stochastics move into oversold with MACD momentum down, looks to be pretty bearish signs.
posted by emacro @ 7:27 PM
0 comments
![]()
![]()
 20060717 10:10 am. Buy signal on 13 tick chart FKLI on MACD divergence.
posted by emacro @ 11:15 AM
0 comments
![]()
![]()
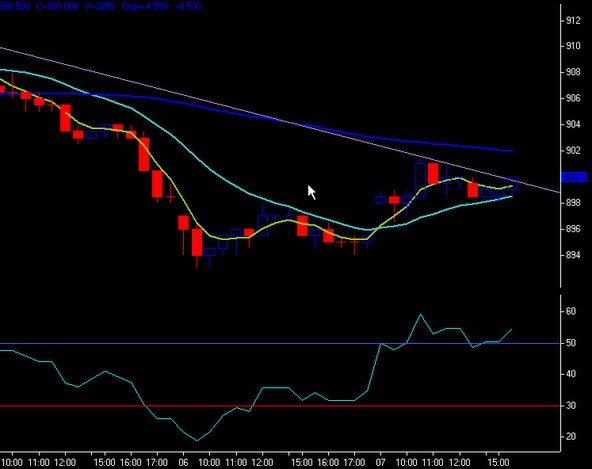
 20060714 12:30 pm. FKLI stochastics cross down, giving 'heads up' on momentum shift.
posted by emacro @ 2:31 PM
0 comments
![]()
![]()
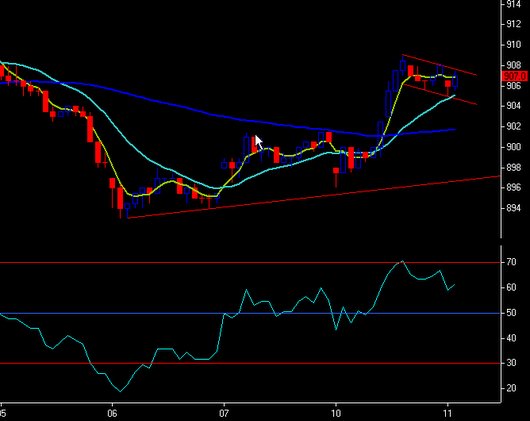
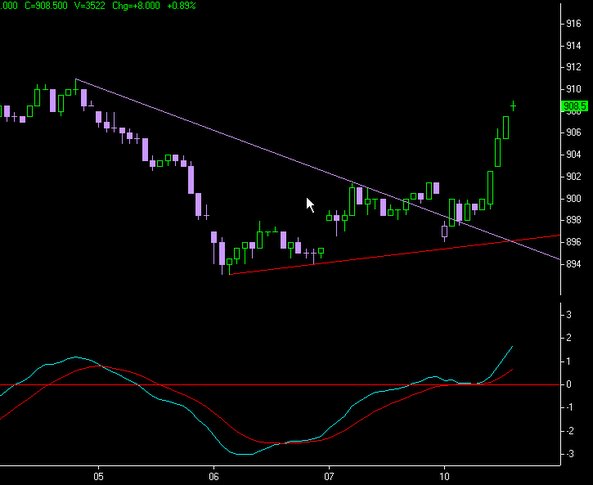
 20060711 10;37 am. FKLi bull flag breaks at 908 and reaches high of 912.
posted by emacro @ 10:46 AM
0 comments
![]()
![]()
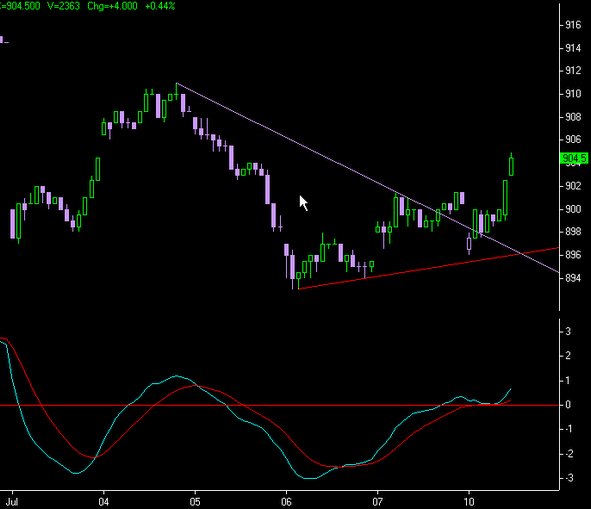
 20060711 9:24 am. A bull flag consolidation? We shall have to see what happens.
posted by emacro @ 9:39 AM
0 comments
![]()
![]()
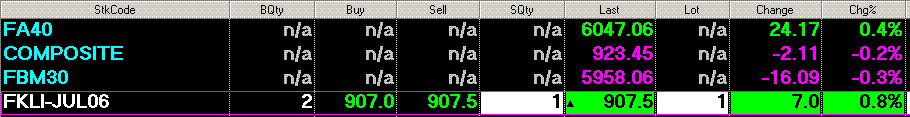
 20060710 2:42 pm. FKLI July reaches high of 909. The snapshot of the key indices show how far behind a laggard the Malaysian stock indices are, with the KLCI and FBM30 indices not performing to the level of the FA40 index. This is a symptom of how the stockmarket in Malaysia has stood still during the time of the capital controls, while the other markets have bounded ahead to all move in tandem. Let's hope we get reforms that stimulate more activity and liquidity.
posted by emacro @ 2:48 PM
0 comments
![]()
![]()
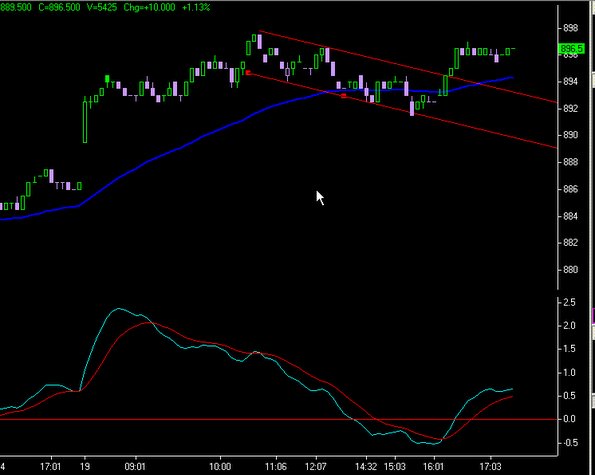
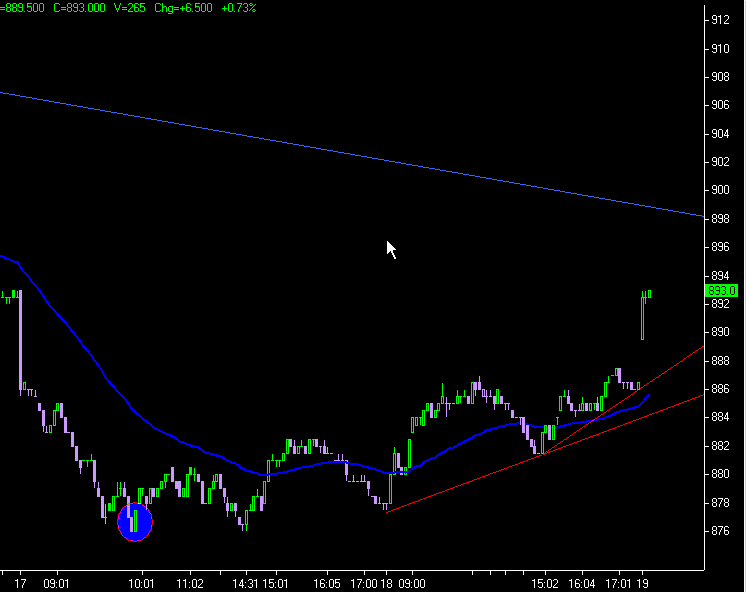
 20060710 12:06 pm. A bit of patience in holding the long FKLI breakout position pays off.
posted by emacro @ 12:13 PM
0 comments
![]()
![]()
posted by emacro @ 11:12 AM
0 comments
![]()
![]()
 20060707 3:29 pm. FKLI eyeing a break above the trendline for long position.
posted by emacro @ 3:38 PM
0 comments
![]()
![]()
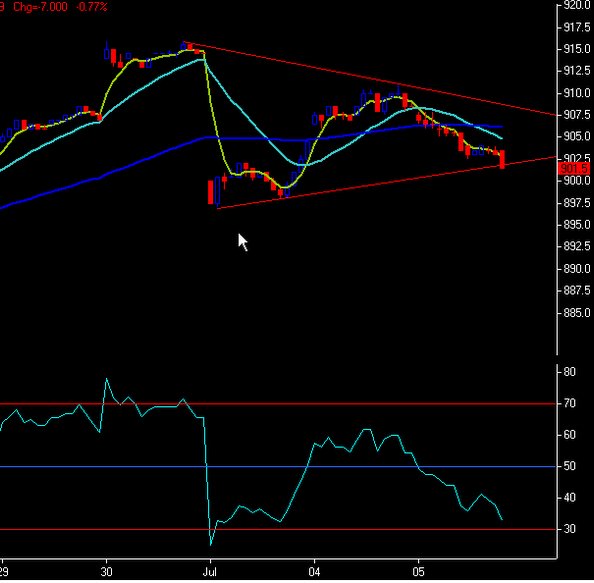
 20060706 10:44 am. Daily chart provides clues as to market momentum. Stochastics cross down provides heads up.
posted by emacro @ 10:53 AM
0 comments
![]()
![]()
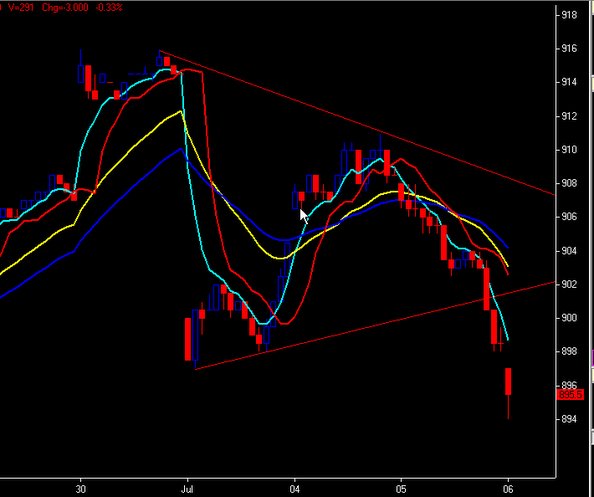 20060706 8:48 am. After the trendline break short, FKLI July touches 894 in premarket trade.
posted by emacro @ 9:00 AM
0 comments
![]()
![]()
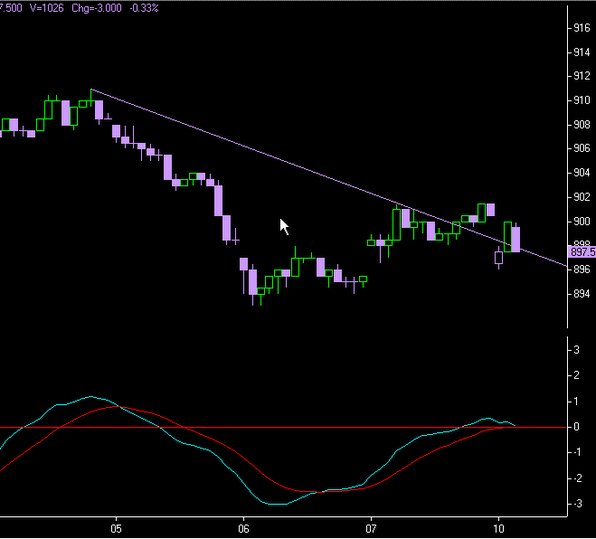
 20060705 4:13 pm. FKLI July testing and trying to break a support trendline.
posted by emacro @ 4:22 PM
0 comments
![]()
![]()