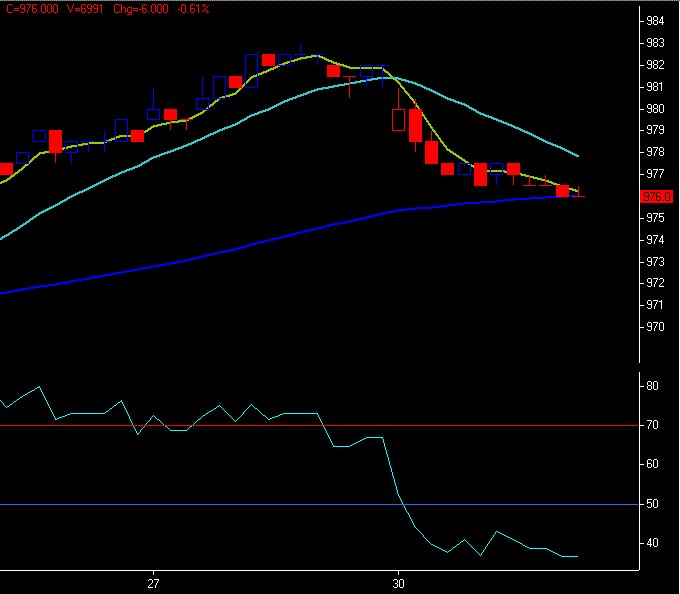
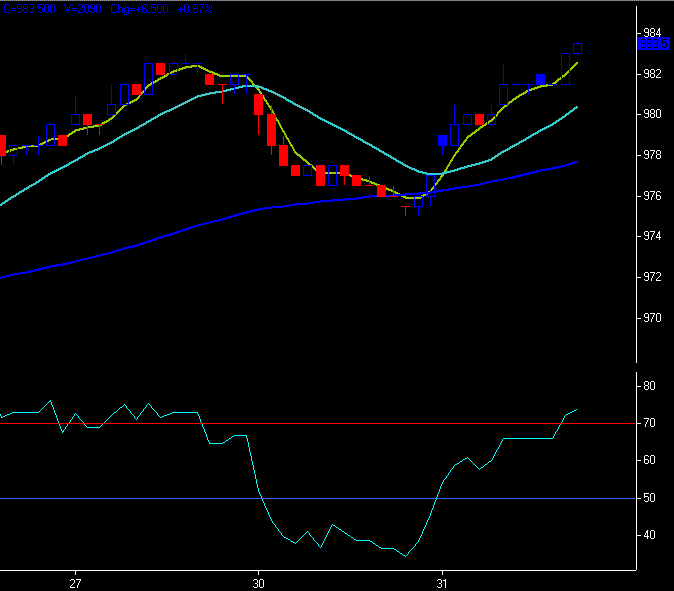
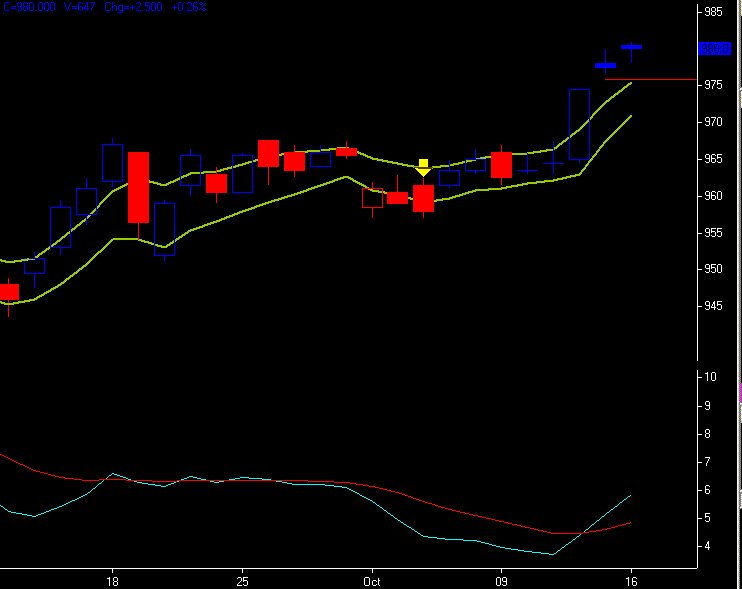
20061031 5:15 pm. FKLI Nov closes 985. If it opens here will create a gap down on the continuous chart tomorrow morning.
posted by emacro @ 5:29 PM
0 comments
![]()
![]()
This will chronicle trading in the FKLI & FCPO futures. If you don't like what you see/read in this blog, just surf away. These opinions are our personal opinions and just a record of our thoughts..."In evolution, it’s not the biggest, the fiercest nor the smartest that survive, it’s the one that changes the fastest.” I.e. the key word is to adapt the trading style to the markets, until it stops working
20061031 5:15 pm. FKLI Nov closes 985. If it opens here will create a gap down on the continuous chart tomorrow morning.
posted by emacro @ 5:29 PM
0 comments
![]()
![]()
 20061031 3:40 pm. With movement in favour of the long position, stop can be moved to 2.5 points from entry, 976.50.
posted by emacro @ 3:52 PM
0 comments
![]()
![]()
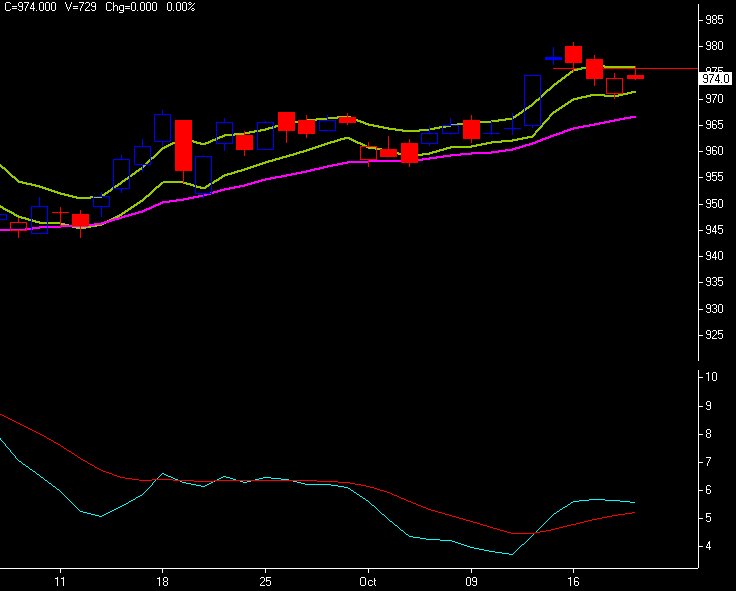
 20061031 11:09 am. FKLI Nov mov avg crossovers, so longs taken at 979, with stop initially at 5 points.
posted by emacro @ 11:27 AM
0 comments
![]()
![]()
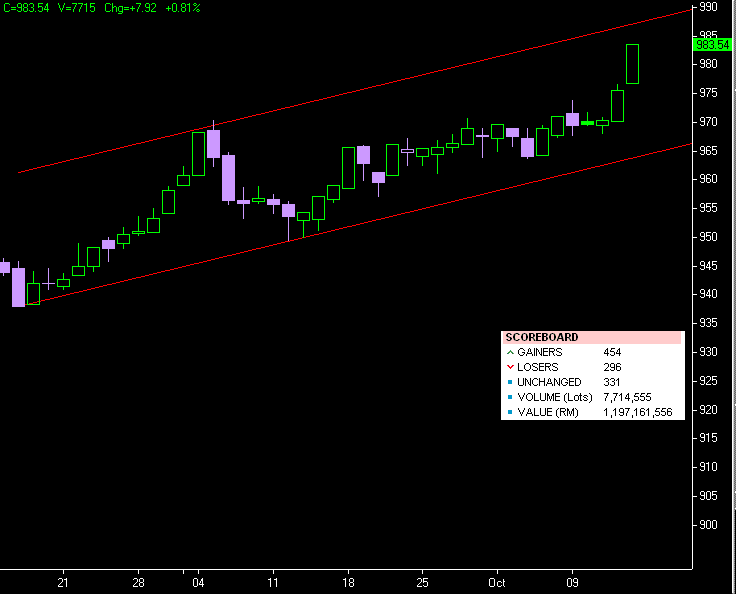
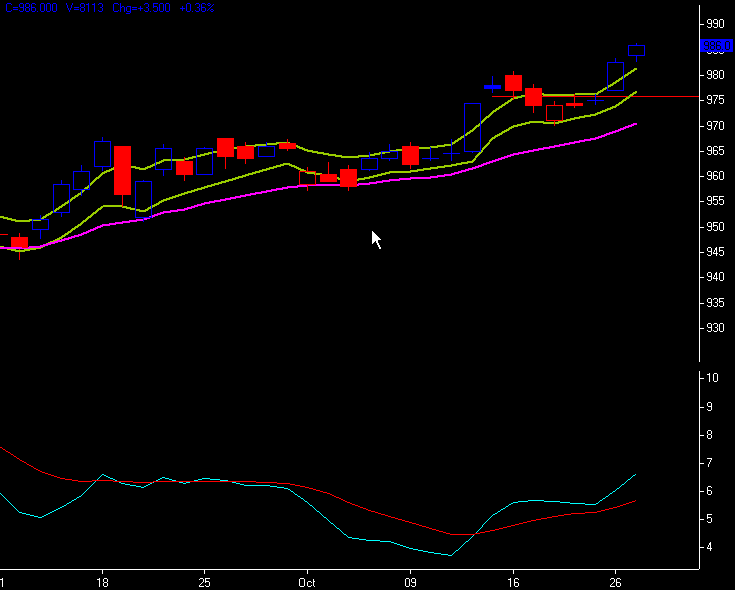 20061027 11:55 am. New highs for the FKLI. Let's look back at this trade and see what caused us to enter and manage it in the way we did. We identified the dominant candle, in which buyers were in control of the market, so the logic was to buy the retracement in the FKLI. The decision was made to buy retracement to the moving average channels (5 ema of the high and low). Fills for the longs were at 985, with the opportunity to average at the lower band.(but this was not done). From the outset, the stop loss was floating, using the 21 ema. If price of the FKLI closed below the 21 ema, the long trade would have been closed. Throughout the whole trade, the MACD momentum gave us a heads up on the 'path of least resistance', which was another reassuring factor to stay in the trade.
posted by emacro @ 12:08 PM
0 comments
![]()
![]()
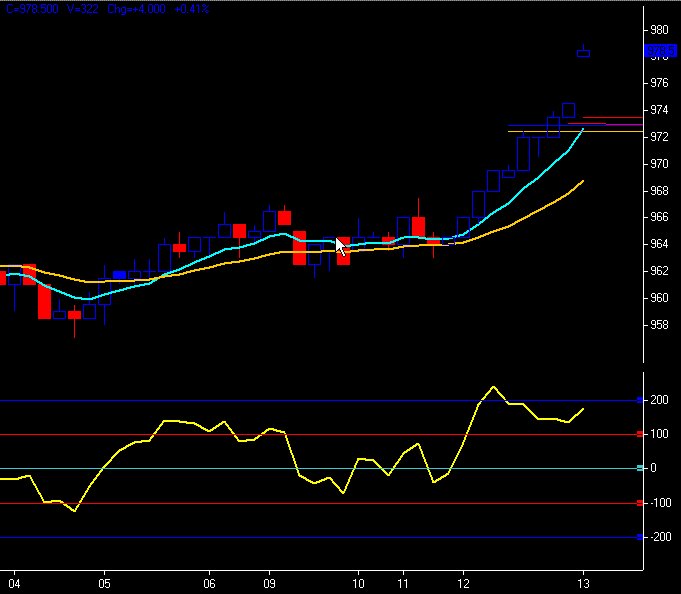
 20061026 12:30 pm. Patience in holding on to longs taken at the MA bands, pays off today.
posted by emacro @ 1:01 PM
0 comments
![]()
![]()
 20061018 5:15 pm. FKLI Oct ends up for the day, longs still in play.
posted by emacro @ 5:45 PM
0 comments
![]()
![]()
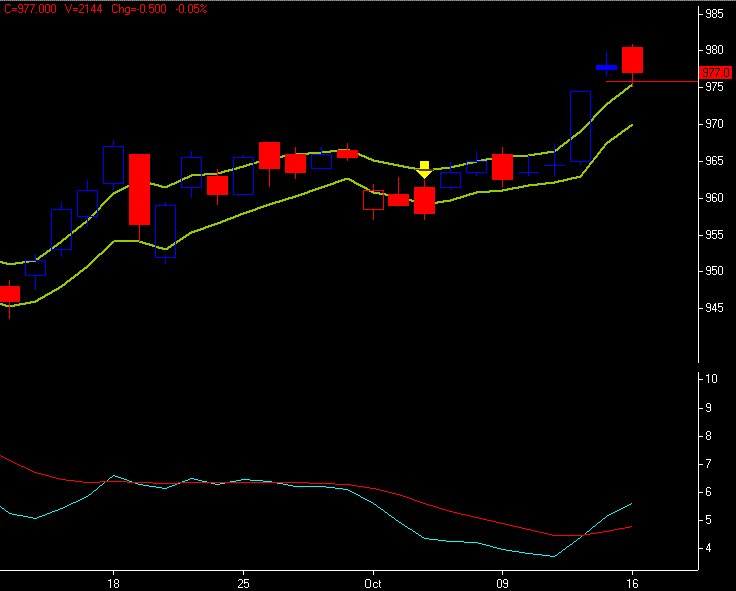
 20061017 5:15 pm. FKLI closes weak. MACD momentum still positive, and as long as prices doesn't go below the big candle (dominant) of 4 days ago, should auger ok fo rthe uptrend.
posted by emacro @ 5:26 PM
0 comments
![]()
![]()
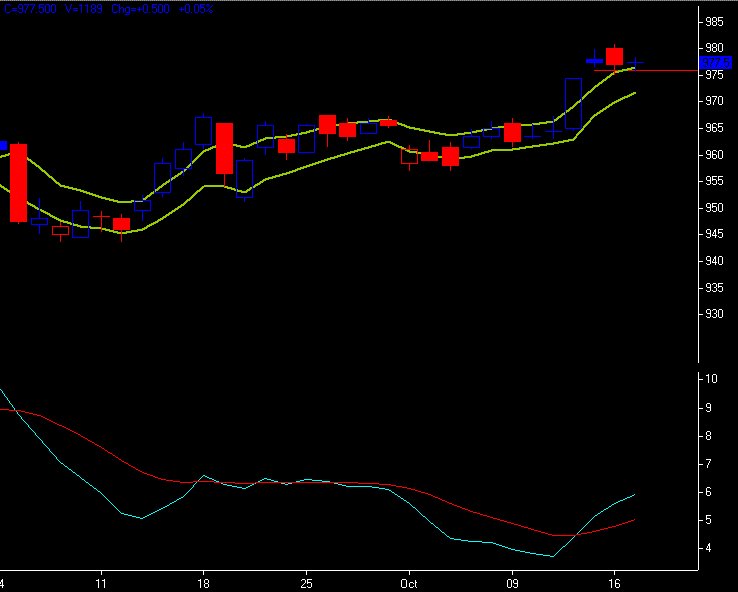 20061017 12:45 pm. FKLI MACD on dailies show the way for momentum. Upper band channel seems to be holding, augering well for the longs taken yesterday.
posted by emacro @ 2:10 PM
0 comments
![]()
![]()
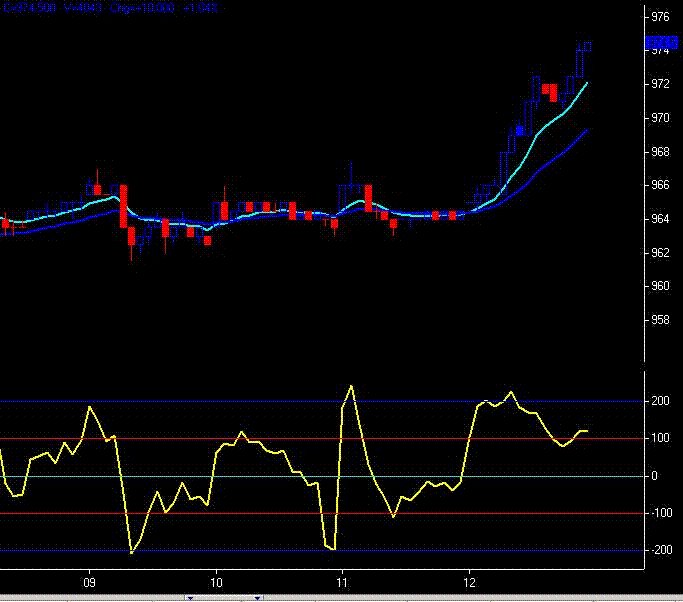
 20061016 5:15 pm. FKLI touches the band intraday, triggering longs.
posted by emacro @ 5:27 PM
0 comments
![]()
![]()
 20061016 10:55 am. Waiting for FKLI daily price to retrace to the upper band for the long trade.
posted by emacro @ 3:12 PM
0 comments
![]()
![]()
posted by emacro @ 6:07 PM
0 comments
![]()
![]()
 20061013 8:55 am. FKLI gaps up on Wall St rally. Watching the Fib cluster supports.
posted by emacro @ 9:06 AM
0 comments
![]()
![]()
 20061012 FLI broke out for the rally today. Alas, we were not watching the market, sometimes that is how the cookie crumbles. However watching for next setup.
posted by emacro @ 8:07 AM
0 comments
![]()
![]()
 20061011 9:00 am. FKLI closes above the money management line, invalidating the short trade.
posted by emacro @ 9:11 AM
0 comments
![]()
![]()
 20061010 5:15pm. FKLI closes, pattern still valid. One thing, the FKLI market seems to be drying up in volume and participation.
posted by emacro @ 5:30 PM
0 comments
![]()
![]()
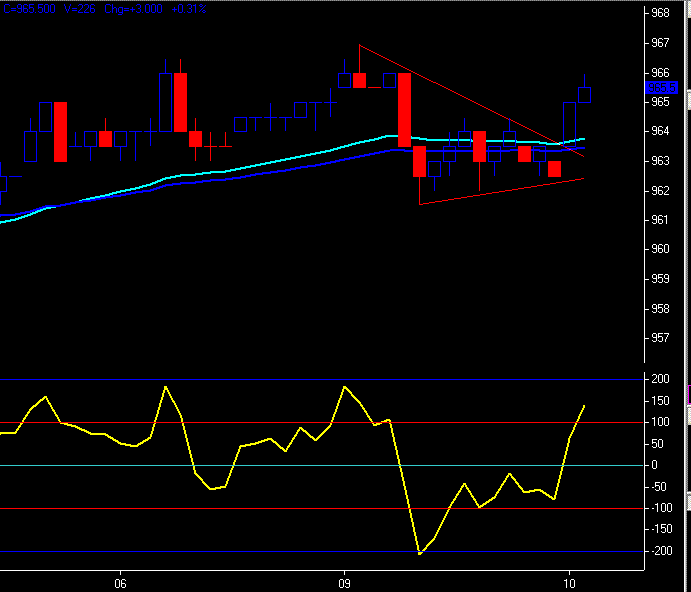 20061010 9:09 am. Bear flag failed. FKLI breaks out of triangle.
posted by emacro @ 9:17 AM
0 comments
![]()
![]()
 20061009 12:40 pm. Watching this possible 'bear flag' pattern for continuation.
posted by emacro @ 12:51 PM
0 comments
![]()
![]()
 20061004 11:02 am. Staying the course with the short trade on FKLi turned out to be the right thing to do.
posted by emacro @ 11:13 AM
0 comments
![]()
![]()
 20061004 8:57 am. FKLI gaps up after the DJIA reaches record high overnight.
posted by emacro @ 9:08 AM
0 comments
![]()
![]()
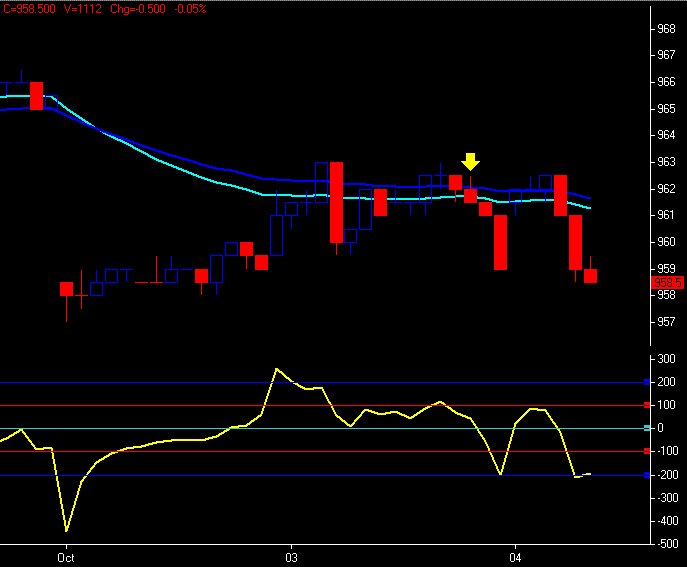
 20061003 5:15 pm. FKLI into the close. Note the dominant candle that predicated the short bias.
posted by emacro @ 5:26 PM
0 comments
![]()
![]()
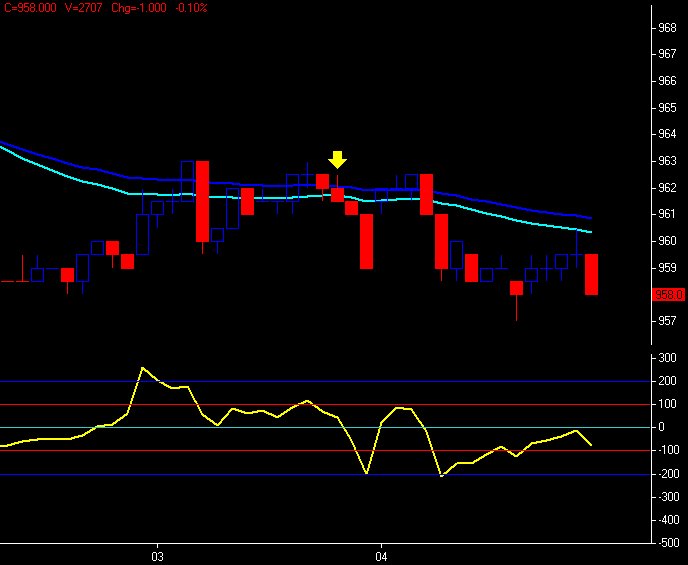
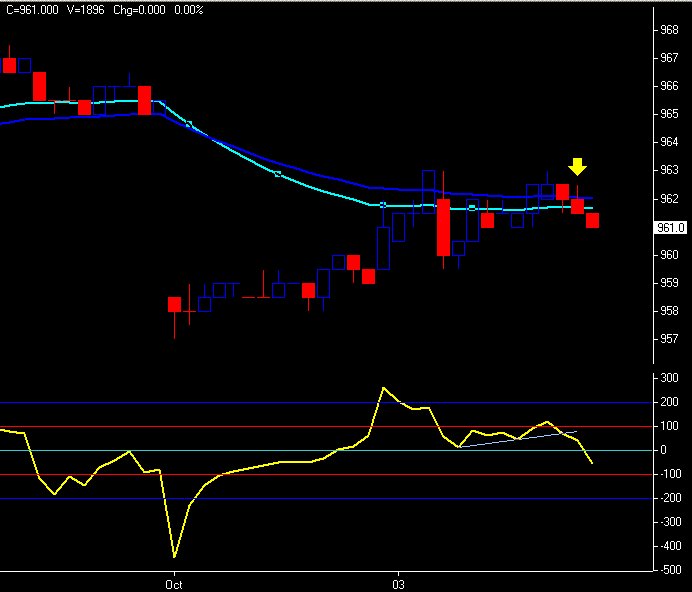 20061003 4:38 pm. FKLI shorts taken on trendline break on the indicator, supported by indicator divergence.
posted by emacro @ 4:46 PM
0 comments
![]()
![]()
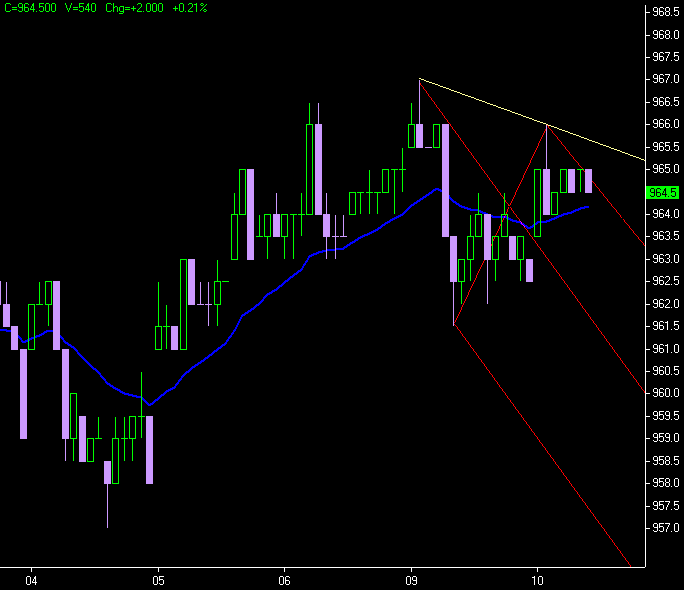
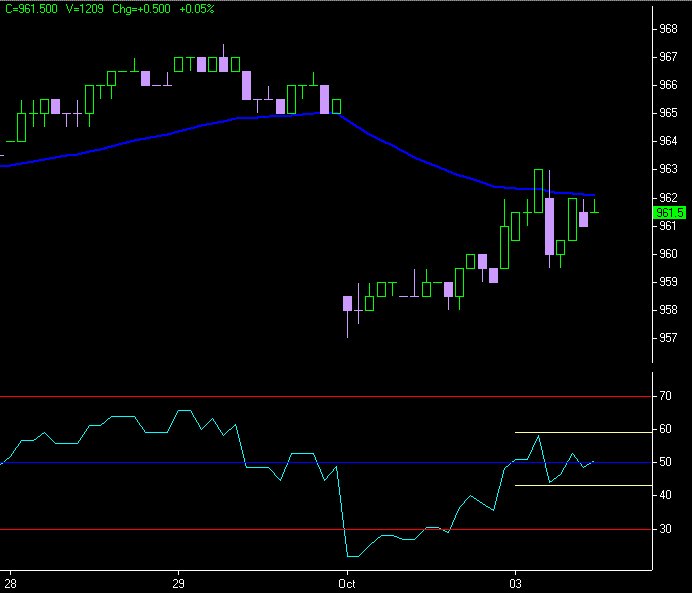 20061003 12:26 pm. With the RSI hovering around the 50 region, consolidation is indicated, possibly pointing to the breakout. We'll consider going with the direction of the RSI break.
posted by emacro @ 12:38 PM
0 comments
![]()
![]()
 20061003 9:11 am. FKLi in the process of the gap fill.(due to change of month)
posted by emacro @ 9:24 AM
0 comments
![]()
![]()