 20060529 Cash KLCI daily chart shows the stance in the market, supported by the 200 ma and path of least resistance looks to be down.
posted by emacro @ 6:11 PM
0 comments
![]()
![]()
This will chronicle trading in the FKLI & FCPO futures. If you don't like what you see/read in this blog, just surf away. These opinions are our personal opinions and just a record of our thoughts..."In evolution, it’s not the biggest, the fiercest nor the smartest that survive, it’s the one that changes the fastest.” I.e. the key word is to adapt the trading style to the markets, until it stops working
20060529 Cash KLCI daily chart shows the stance in the market, supported by the 200 ma and path of least resistance looks to be down.
posted by emacro @ 6:11 PM
0 comments
![]()
![]()
 20060526 Support established by the 'hammer' candlestick holds, with prices maintaining above that level.
posted by emacro @ 12:07 PM
0 comments
![]()
![]()
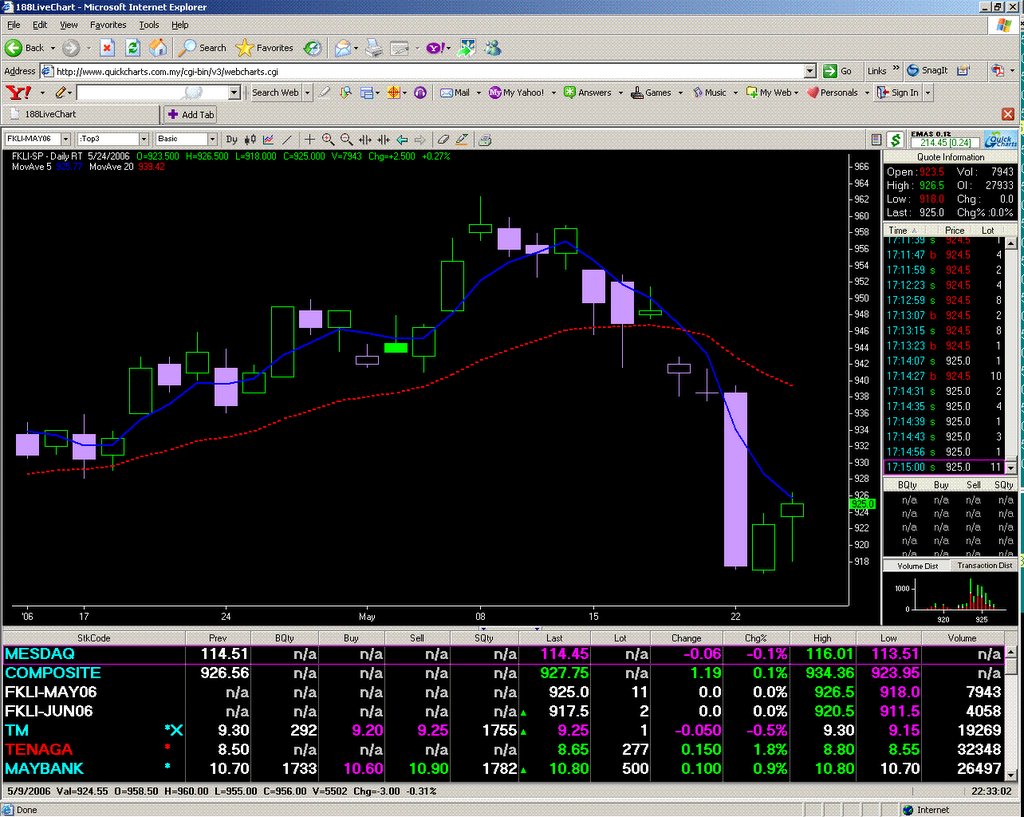 20060524 FKLI May daily close is a hammer formation, indicating selling may be subsiding, or buyers stepping up.
posted by emacro @ 10:38 PM
0 comments
![]()
![]()
 20060524 10:35 am. FKLI up 3.5 points. The hammer on the cash, 200 day mov avg support and intraday MACD supports this move up.
posted by emacro @ 10:41 AM
0 comments
![]()
![]()
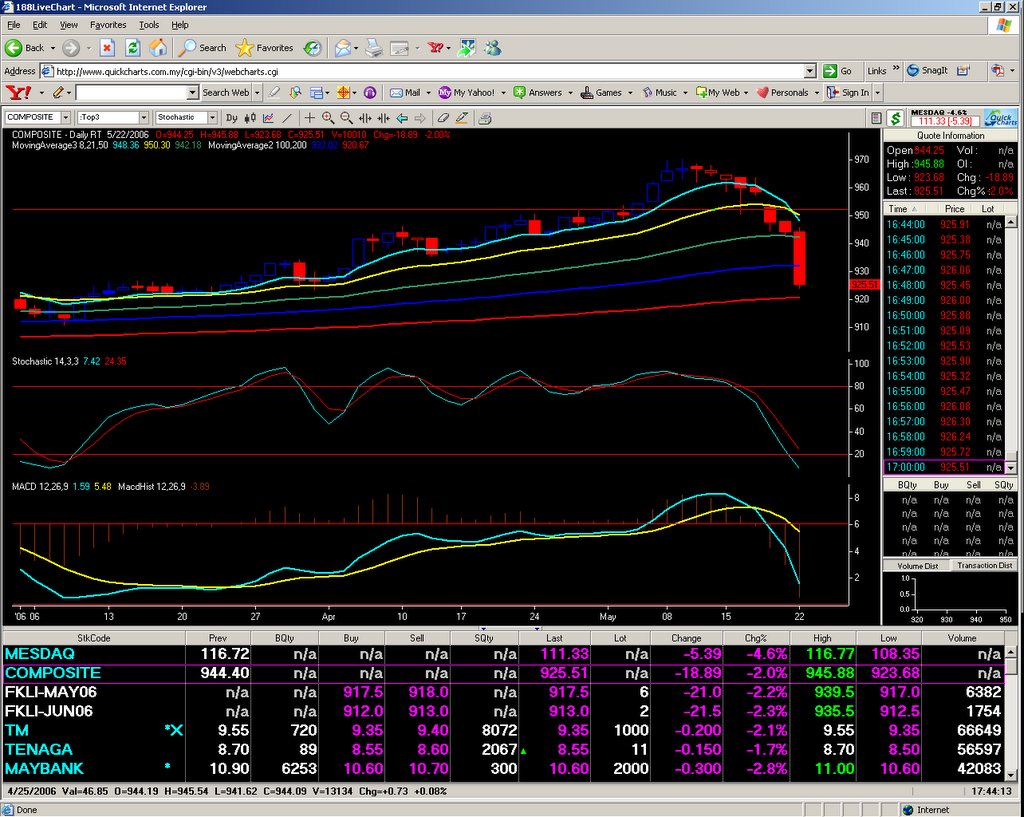
 20060523 A hammer pattern, with stochastics oversold indicates possibility of reversal.
posted by emacro @ 10:26 PM
0 comments
![]()
![]()
 20060522 Daily momentum indicators were pointing down, which contributed to the downfall in strategy today.
posted by emacro @ 5:47 PM
0 comments
![]()
![]()
 20060522 FKLi longs taken 930, stopped out with FKLI blowing through all support levels. Contagion from Bombay stocks which dropped >10%.
posted by emacro @ 5:18 PM
0 comments
![]()
![]()
 20060519 Close. 30 min chart for the week that has gone before us. Ugly downtrend for stock players. 930 is a confluence of support from some fib extension 162% levels and previous resistance on the way up. Might look for technical rebound play off that level next week for May FKLI.
posted by emacro @ 5:43 PM
0 comments
![]()
![]()
 20060518 50 ema daily equivalent plotted on the 30 min FKLI provides support below the market. DJIA did fall 214 in US trade.
posted by emacro @ 3:32 PM
0 comments
![]()
![]()
 20060517 Lunch session close. FKLI 30 min chart with equivalent of daily moving averages, instructive of how they show resistance and support.
posted by emacro @ 2:21 PM
0 comments
![]()
![]()
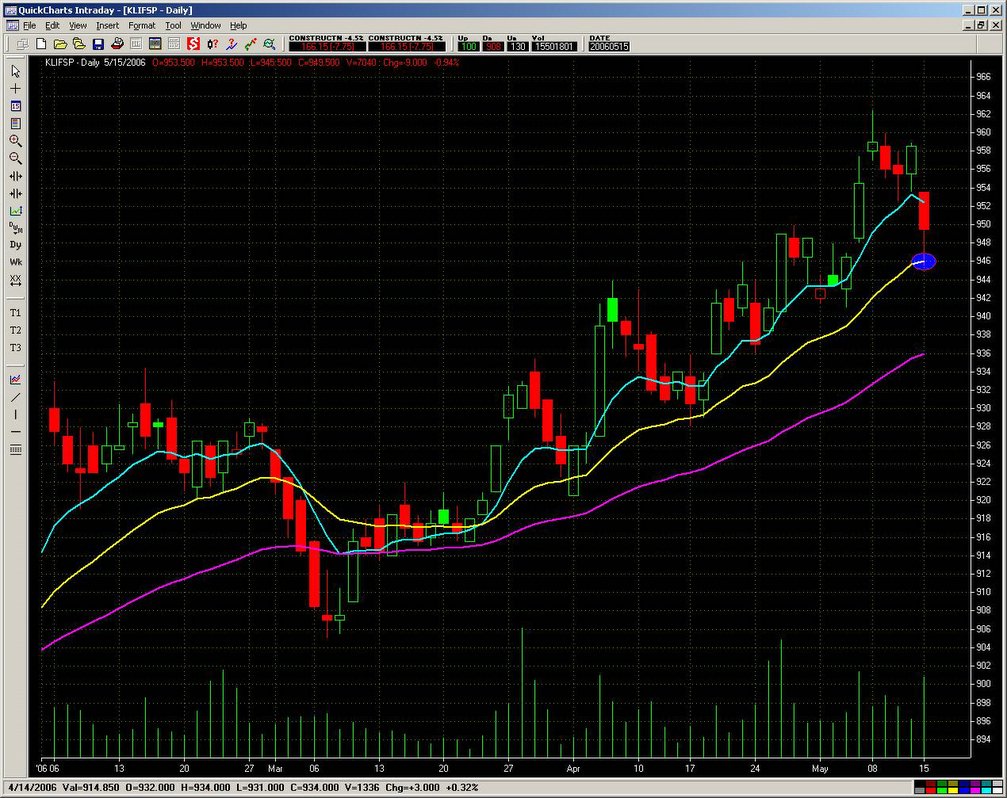 20060516 9:17 am. Daily chart of FKLI shows the use of daily moving averages to define support/resistance.
posted by emacro @ 9:22 AM
0 comments
![]()
![]()
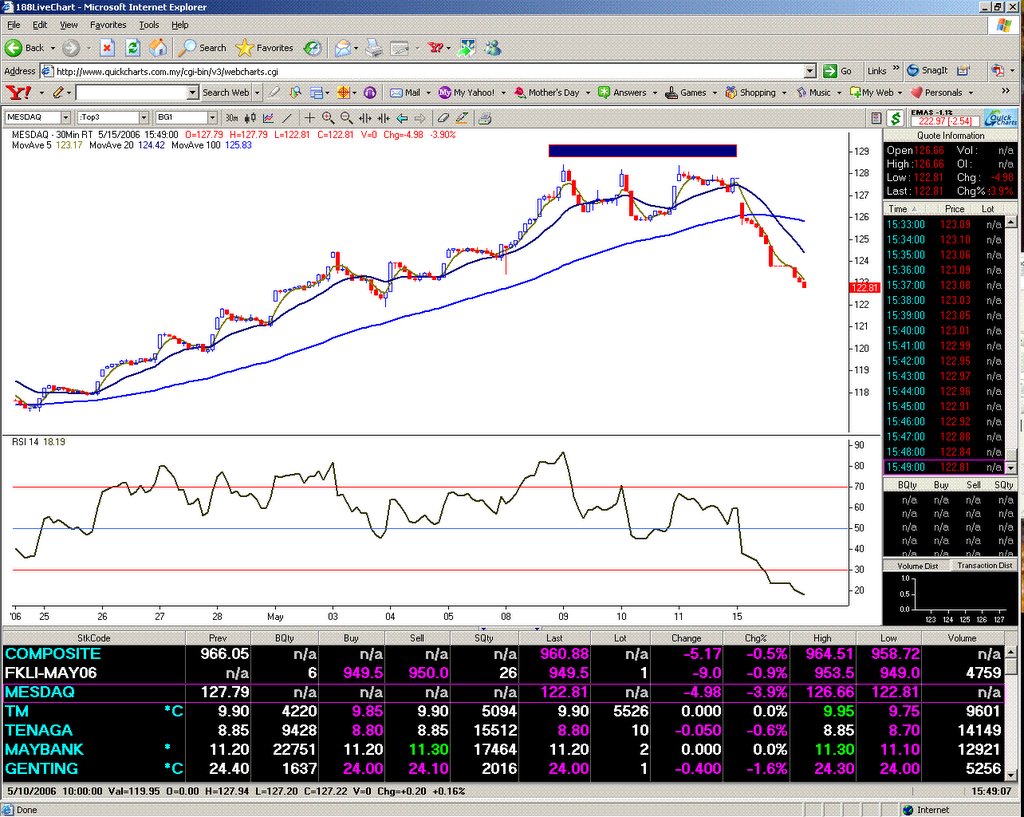 20060515 3:50 pm. Looking at the Mesdaq index 30 min chart, in hindsight we see a triple top. Since this pattern is pretty rare, this could be pretty significant.
posted by emacro @ 4:07 PM
0 comments
![]()
![]()
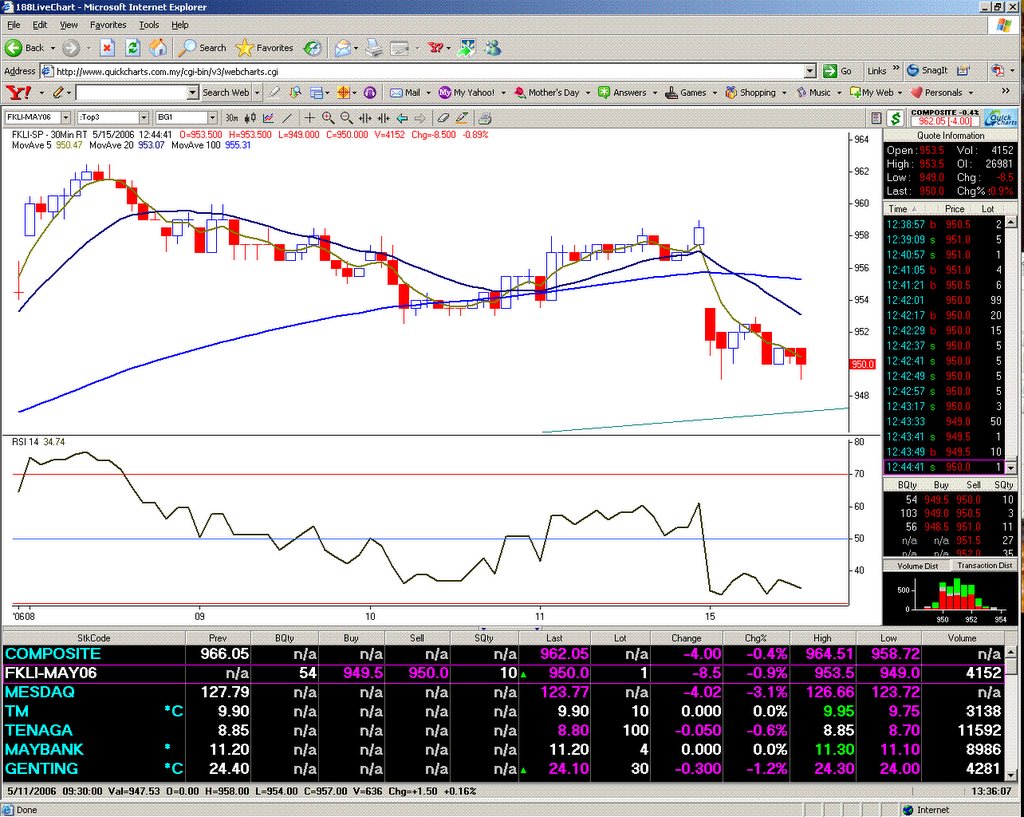 20060515 Lunch session break update. Looks to have good chance to get into the support zone, with all moving averages pointing to a path of least resistance down.
posted by emacro @ 1:45 PM
0 comments
![]()
![]()
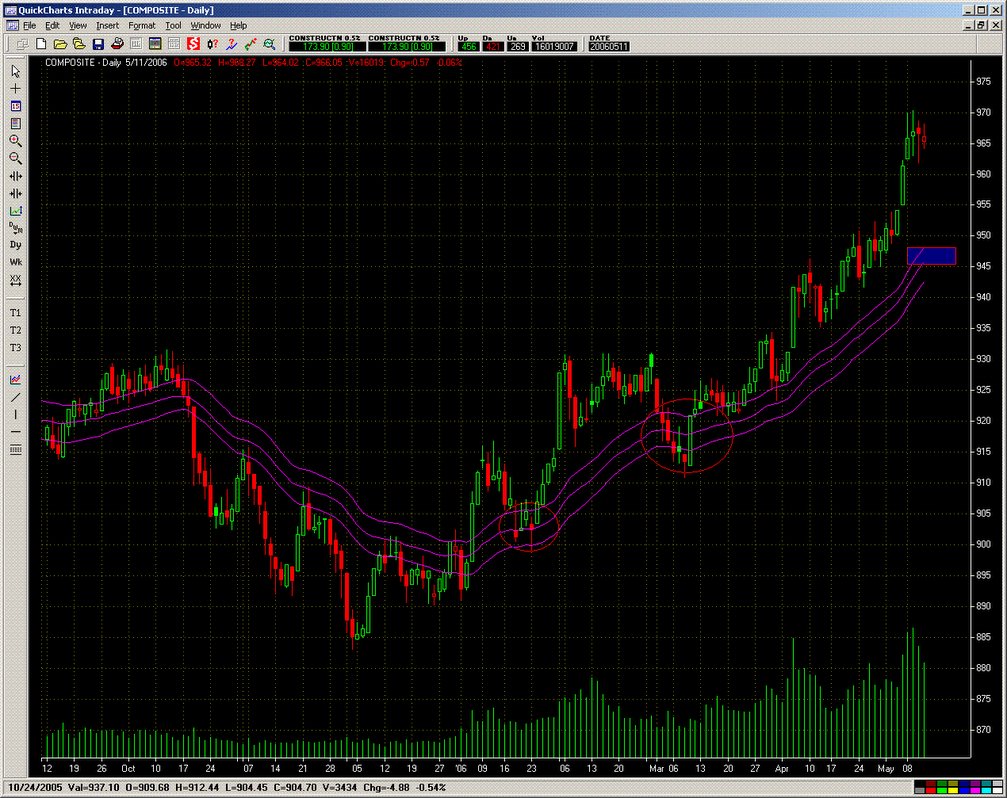 20060512 With the selloff in the world markets, how can FKLI traders use as strategy. For one, looking at the 3 moving averages in the chart, will give clues as to areas of support for the cash index. If we are thinking that there will be 16 days to go to expiration, with a significant discount, I would venture that long at the bands and holding to expiration might provide a high probability trade, which would be safest rather than trade through the volatility, long or short.
posted by emacro @ 11:33 PM
0 comments
![]()
![]()
20060511 After market close today, Bursamalaysia made IRIS shares 'designated securities', which may impact on FKLI trade for the next trading day. Now we know the explaination of the persistent large discount of FKLI May this past week.
posted by emacro @ 8:18 PM
0 comments
![]()
![]()
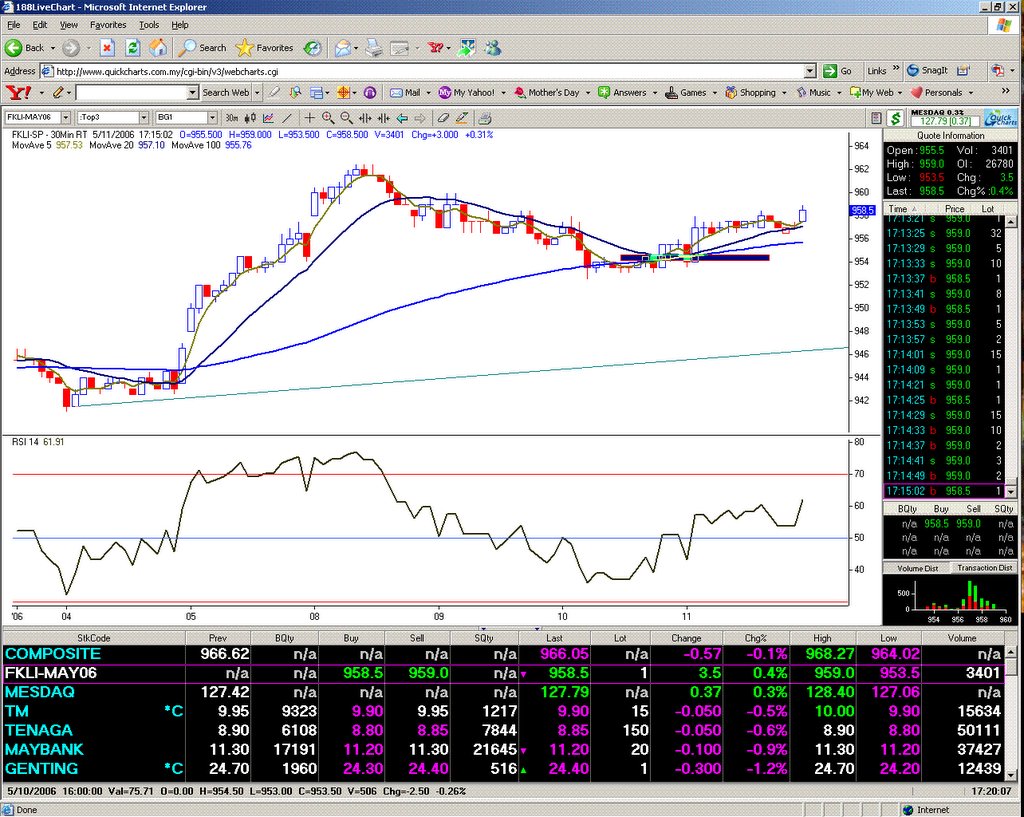 20060511 Close. FKLI managed to hold the area of support (rectangle where the 3 moving averages formed a confluence). RSI has also been consistency above the 50 level. If traders were not long, certainty there were not many reasons to short the FKLI off this pattern. Closes near highs.
posted by emacro @ 5:26 PM
0 comments
![]()
![]()
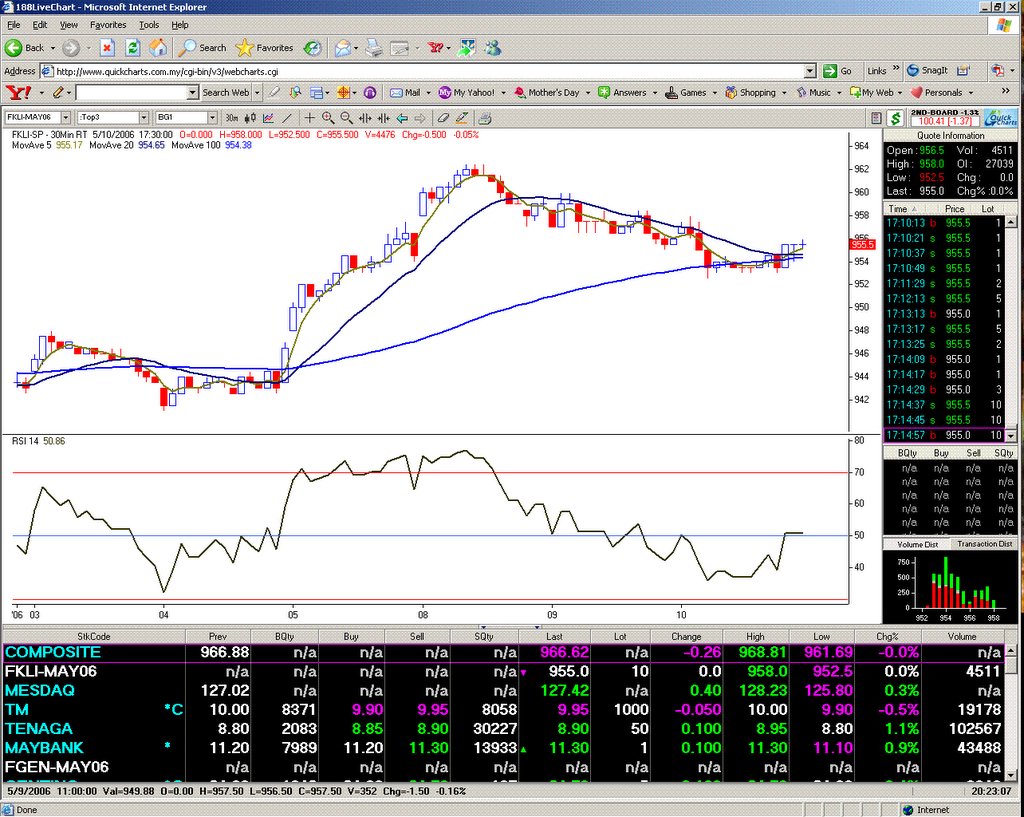 20060510 FKLI comes into a confluence where the 3 moving averages all come together. This is a prelude to a big move, either direction.
posted by emacro @ 8:27 PM
0 comments
![]()
![]()
 20060505 Cash KLCI chart shows nice momentum, but will be on the lookout for weakening ofthe trend through indecisive candle action on the daily chart.
posted by emacro @ 4:32 PM
0 comments
![]()
![]()
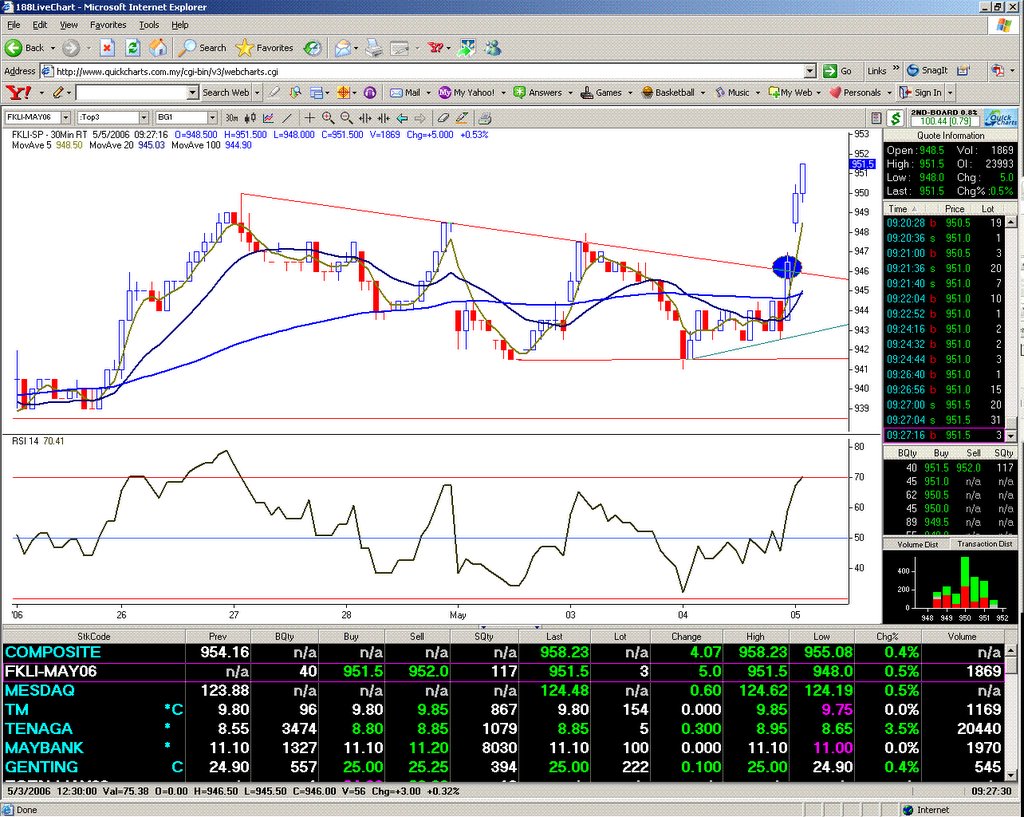 20060505 9:30 am. Break out bar of the trendline (with 3 touches by price=resistance) came yesterday on the last candle.
posted by emacro @ 10:07 AM
0 comments
![]()
![]()
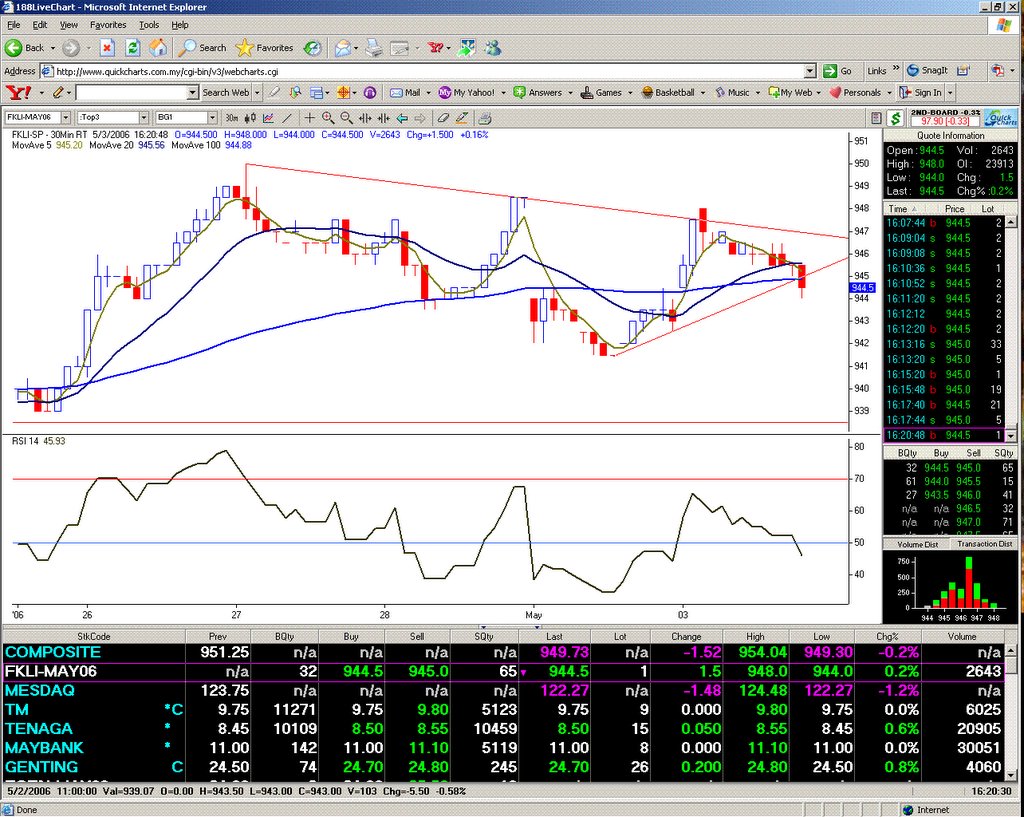 20060503 4:20 pm. A break of a small uptrend line. Let's see if there is follow through on the downside.
posted by emacro @ 4:26 PM
0 comments
![]()
![]()
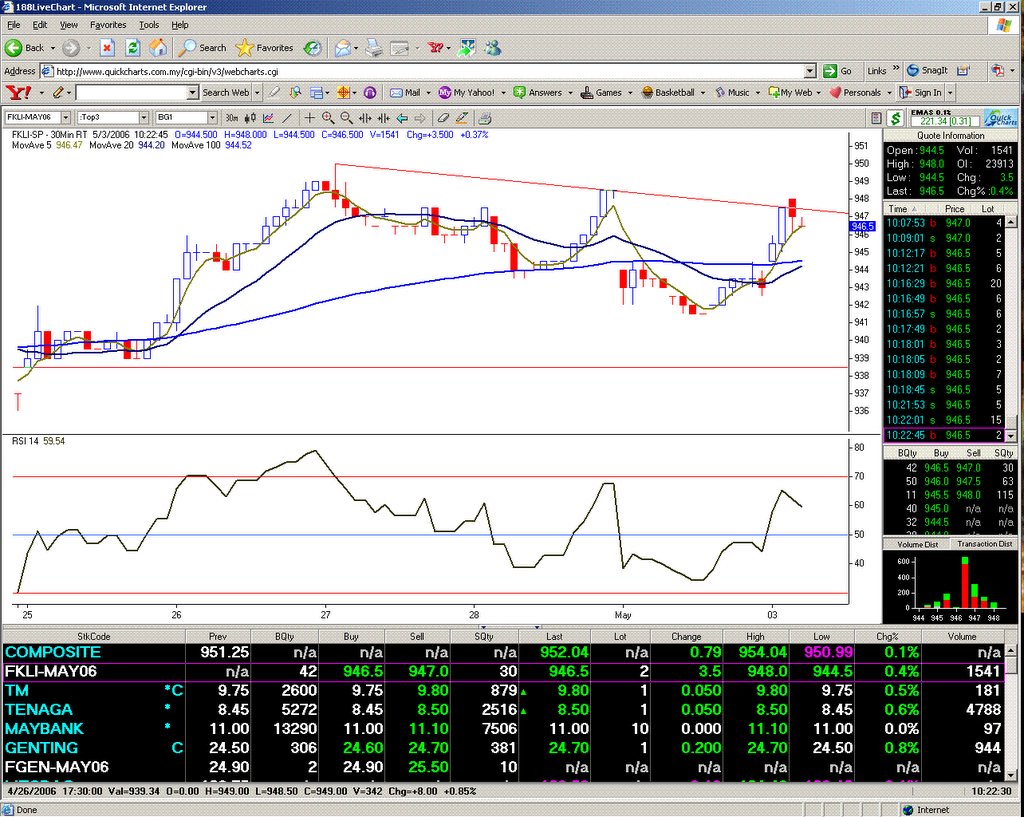 20060503 10:22 am. FKLI comes up to fill the gap. (Gap filling trade setup). Notice the Genting SSF FGEN May contract bidding at 24.90 while the cash offer price is 24.70. This is a clear arbitrage opportunity, but the liquidity providers are unable to take advantage. This is due to the cost of executing in the share transaction being prohibitively high. Bursamalaysia really needs to look into allowing liquidity providers (local participants) cheaper transaction costs for stocks like stockist account or investment account of stockbrokers.
posted by emacro @ 10:33 AM
0 comments
![]()
![]()
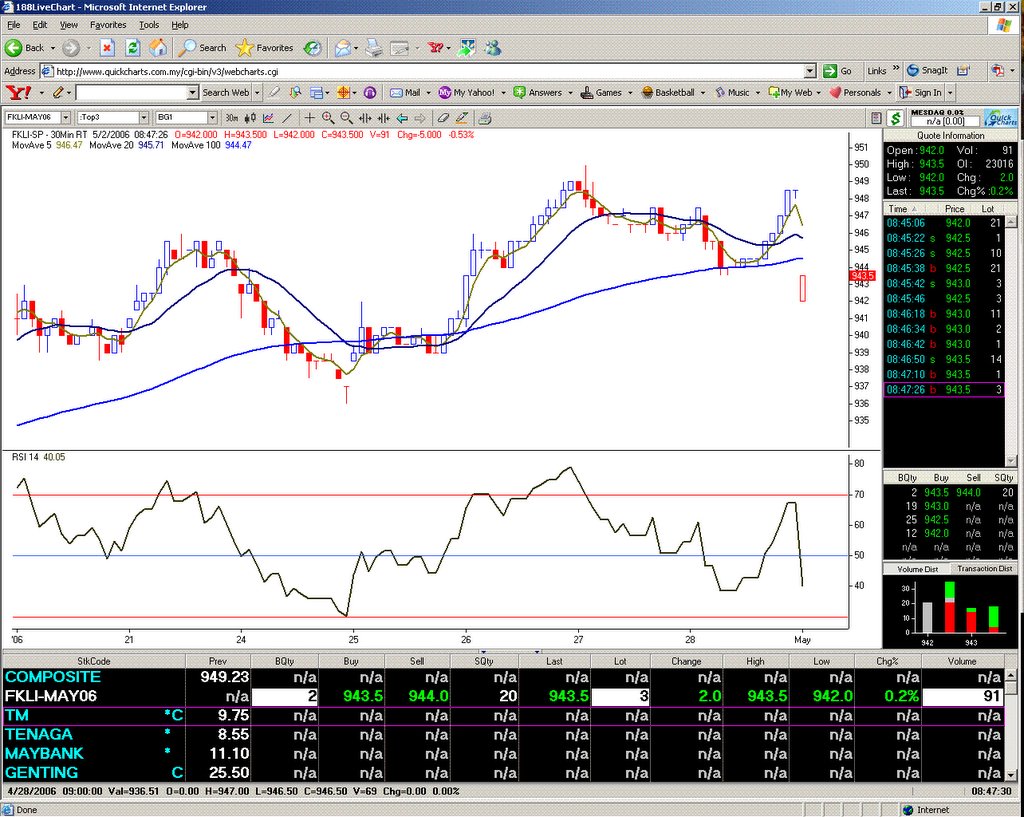 20060502 8;50 am. FKLI gaps down on the continuous chart. Could be opportunity to look for a gap closing trade.
posted by emacro @ 9:14 AM
0 comments
![]()
![]()


