Friday, April 28, 2006

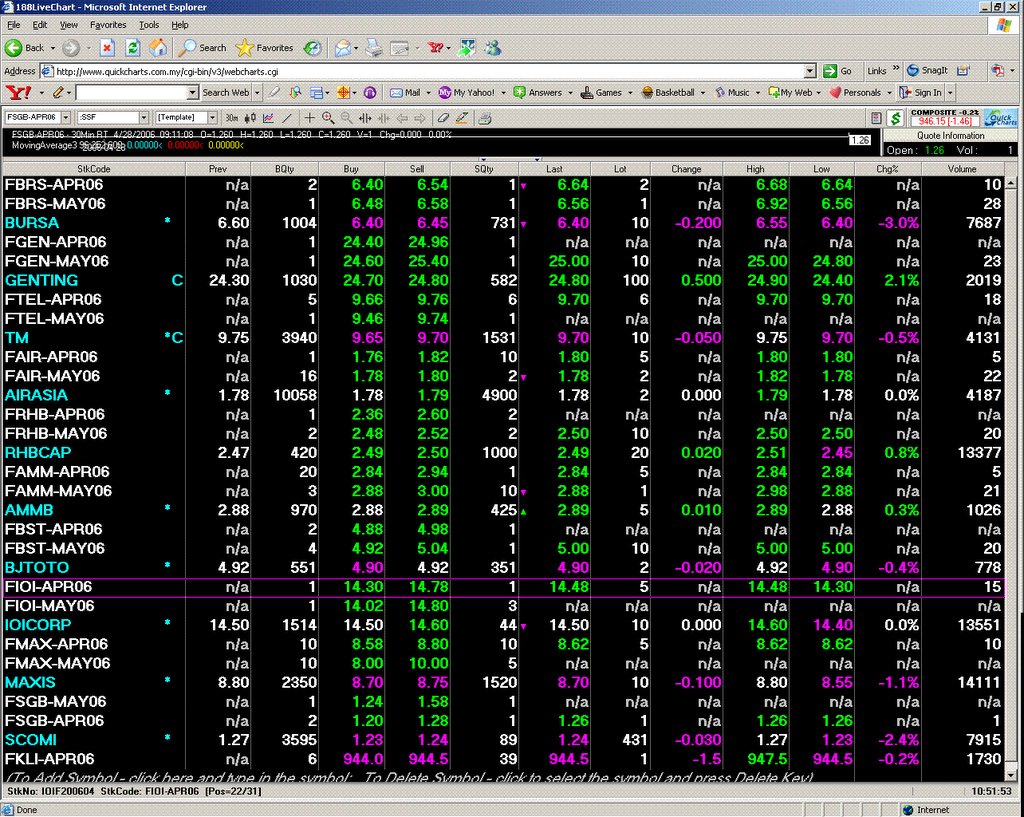
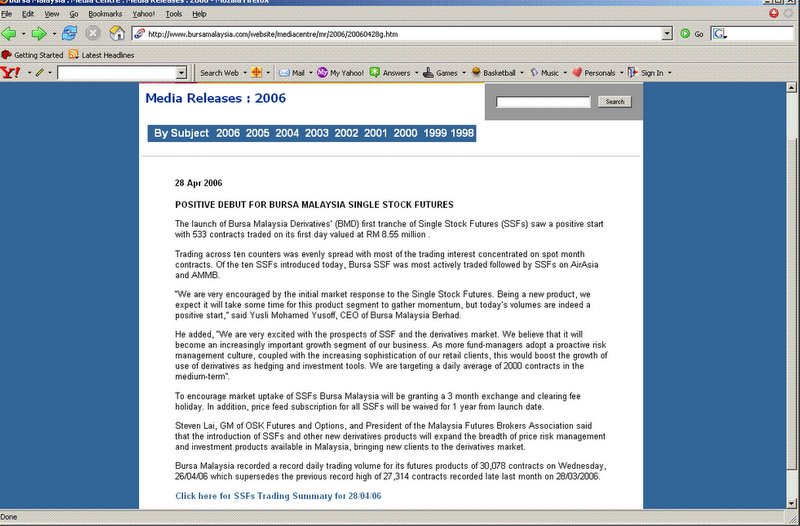
20060428 All in all, 500+ contracts across the 10 SSF series is impressive, given thelimitations of the cumbersome KATS terminal trading. When the technology of BursaTrade becomes available, and the open API and UDS (User Defined Strategies) becomes available, spreads will tighten and activity will pick up. In the future, the SIA and FIA will coalesce, addiding more market participants to the mix. Posted by Picasa

20060428 FKLI rebounds into the close off support levels. Posted by Picasa

20060428 10:50 am. SSF, single stock futures on 10 stocks started trading today on Bursamalaysia Derivatives. Few things to note:
1 Bid ask is wide on most SSF series
2 Low volume traded
Comment: To be successful, SSF needs to have some market makers willing to make the bid ask, and have the facility to lay off risk in the physical cash market. The wide bid ask is a reflection of the high cost of trading stocks in Malaysia. There needs to be an avenue to lay off risk or arbitrage for it to be worthwhile for market makers or local participant to provide the liquidity. Maybe the Exahange can do like the CBOE, whereby the CBOE market makers (in options) are treated as 'specialists' by the NYSE, so they trade stocks at close to zero costs and at very good margin rates. Posted by Picasa

Thursday, April 27, 2006

20060427 11:13 am. FKLI moved out of the confluence of moving averages we identified. Posted by Picasa

Tuesday, April 25, 2006

20060425 Lunch session break. FKLI chart show confluence of flat moving averages, which all converge. This is 'coiling the apring' for a breakout move in either direction from here. Drawing some trendlines and waiting for the break will confirm any impending breakout. Posted by Picasa

20060424 FKLI down into the close. Some factors pointed to shorts at 941. Posted by Picasa

Monday, April 24, 2006

20060424 Factors to support short 1 RSI momentum below 50 2 Short term mov avg crossover. Posted by Picasa

20060424 FKLI closes down. Posted by Picasa

20060424 Close: 1 Mov avg cross down 2 RSI crosses below zero. Two factors that would have supported short trade, but we did not take the trade. Looking forward to tomorrow, might consider longs at 933-4 for settlement on Friday for the April contract. Posted by Picasa

Saturday, April 22, 2006

20060420 FKLI 30 min chart for the past week. Posted by Picasa

Wednesday, April 19, 2006

20060419 3:30 pm. FKLI at 941.0. The breakout level was actually 935, coinciding with the nice down trend line, however since the gap ut to 936 opening today, had to make the decision to long higher levels like 937.50-38 to take advantage of this upside break. This is the nature of trading, sometimes the hard decisions have to be made. Posted by Picasa

20060419 11:58 pm. Cash KLCI chart, most indicators bullish indications. Posted by Picasa

Monday, April 17, 2006

20060417 9:51 am. FKLI held the band of support ralling slightly to 935.50. This "technical condition" can be instructive: the bearish selling tried to break support with great effort and energy, thus the ensuing small rally. This is an inexact trading method of analysis, but combined with other method of trigger, cold have provided nice trade. Posted by Picasa

Friday, April 14, 2006

20060414 3:45 pm. PROTON, reaches resistance of the 3rd downtrend line 5.85. The turtle soup reversal setup took a while, but is near completion. Posted by Picasa

20060414 3:20 pm. BURSA is on the retracement off the highs. The horizontal red line and the red moving average (equivalent to 21 day exp mov avg) shows a confluence at 5.80. Can be a good idea to get on board this stock just ahead of those levels. Posted by Picasa

2060414 10:15 am. Interesting technical condition forming. Posted by Picasa

Thursday, April 13, 2006

20060413 Close. FKLI @ 931. Posted by Picasa

Wednesday, April 12, 2006

20060412 10:00 am. Finally moves down to 932 on the FKLI. Posted by Picasa

Monday, April 10, 2006

20060410 5:15pm FKLI closing. Posted by Picasa

20060410 12:05 pm. 3 factors to indicate a possible short @ 936. 1 Mov avg cross down 2 RSI punch below 50 3 Break of a short trendline (almost horizontal) Posted by Picasa

20060410 10:02 am. Posted by Picasa

Friday, April 07, 2006

20060407 Close for the week. FKLI, after initial strong thrusting move up, consolidating sideways, building up energy for the next move. Posted by Picasa

20060407 2:33 pm. The 90 min chart shows the price action, strong thrust up into sideways consolidation now, bullish indications. Posted by Picasa

Wednesday, April 05, 2006

20060405 FKLI after market close. A bigger move than usual after the breakout. Posted by Picasa

20060405 Lunch session break. FKLI reaches high 935.00 Posted by Picasa


"There is the plain fool who does the wrong thing at all times anywhere, but there is the Wall Street fool who thinks he must trade all the time."J Livermore Manchester City FCl Crude Palm Oil

fcpo.blogspot.com


From Dragons and Bulls by Stanley Kroll
Introduction and Foreword
The Importance of an Investment Strategy
5 The Art of War, by Sun Tau (circa 506 BC) and The Art of Trading Success (circa AD 1994)
That's the way you want to bet
Long-term v Short term trading
Technicals v Fundamentals
Perception v Reality
Part 1: Winners and Losers
Part 2: Winners and Losers
Sun Tzu: The Art of War
Those who tell don't know, those who know don't tell
Why there is no such thing as a "bad market"
The Secret to Trading Success
The Experts, do they know better?
Risk control and money management
Larry Hite: The Billion Dollar fund Manager
Systems Trading:Kroll's Suggested Method
Buy the Strength Sell the Weakness
Good advice
The 'good bets' business by Larry Hite
Don't lose your shirt
Ed Sykota's secret trend trading system