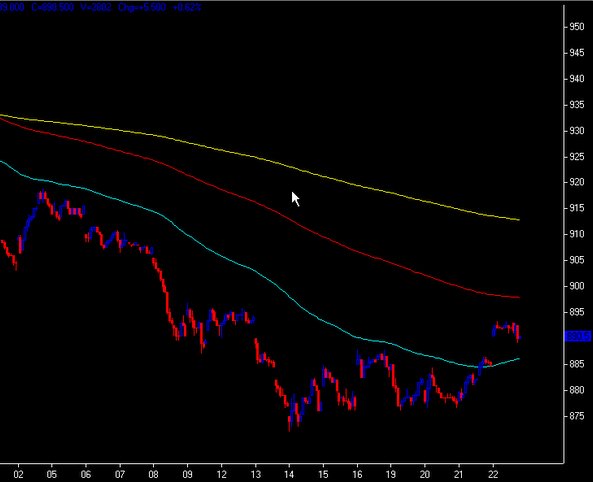
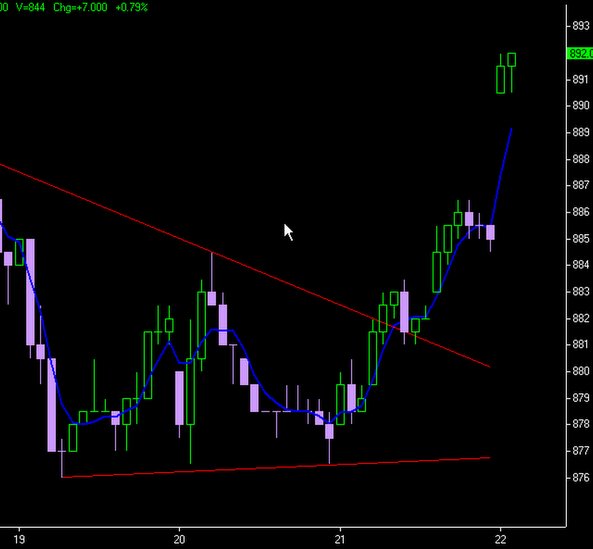
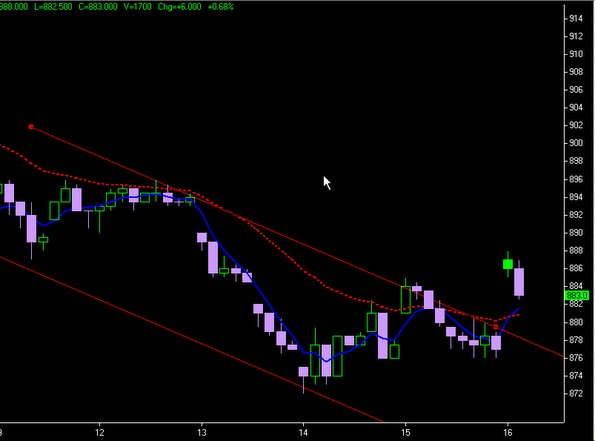
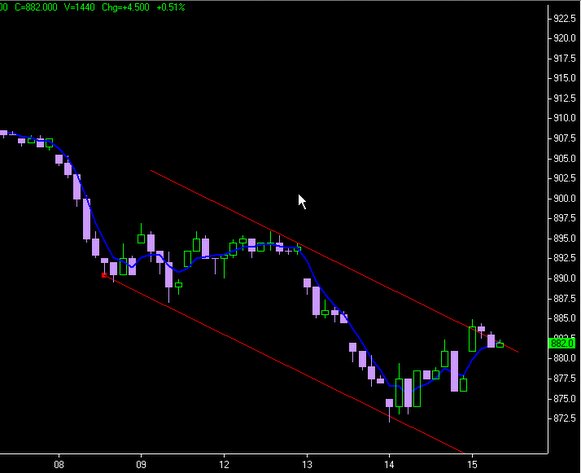
 20060630 2:59 pm. Sometimes the simplest trendline break and price action works best.
posted by emacro @ 3:05 PM
0 comments
![]()
![]()
This will chronicle trading in the FKLI & FCPO futures. If you don't like what you see/read in this blog, just surf away. These opinions are our personal opinions and just a record of our thoughts..."In evolution, it’s not the biggest, the fiercest nor the smartest that survive, it’s the one that changes the fastest.” I.e. the key word is to adapt the trading style to the markets, until it stops working
20060630 2:59 pm. Sometimes the simplest trendline break and price action works best.
posted by emacro @ 3:05 PM
0 comments
![]()
![]()
 20060630 2:15 pm The Bursamalaysia indices, whether it be the KLCI of rhe FTSE indices all show a relative underperformance compared to other stock indices in the region. This is a characteristic which is symptomatic of the Malaysian share market, a state of malaise that the country should be ashamed of, and measures need to address this. However it does provide a clue as to the relative strength of the local bourse vis a vis other markets in the region. One thing to note is that the only difference the new index series provide is the four letters "FTSE" in front of the name. For all intents and purposes, they convey the same information, then the question remains: Why have new indices that give essentially the same information anyway?
posted by emacro @ 2:19 PM
0 comments
![]()
![]()
 20060630 10;20 am. With the 'path of least resistance' on upside, FKLI gaps to the confluence of long term moving avg. Incidently yesterday, the FOMC raised rates to 5.25%.
posted by emacro @ 10:45 AM
0 comments
![]()
![]()
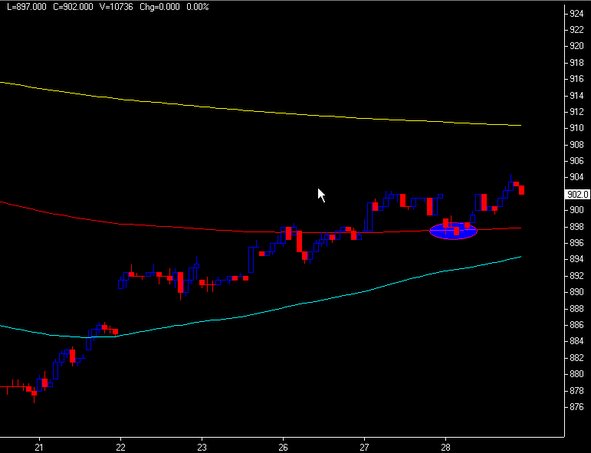 20060628 The ellipse shows the buy zone where the FKLI 30 min chart price action went down to test the equivalent of the 21 ema on the daily chart.
posted by emacro @ 8:42 AM
0 comments
![]()
![]()
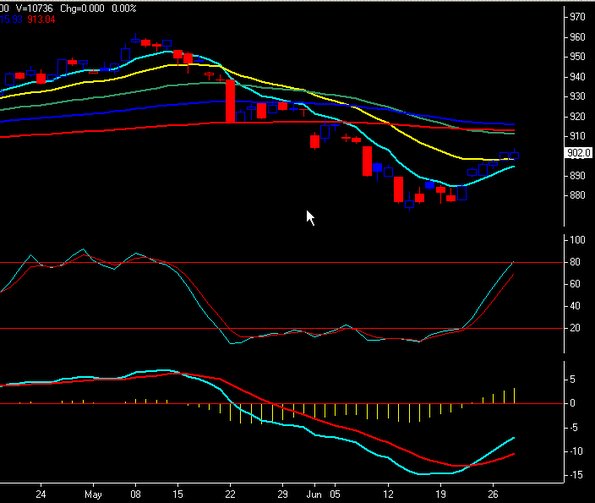 20060628 With the 'path of least resistance' to upside, march upwards of FKLI continues.
posted by emacro @ 9:49 PM
0 comments
![]()
![]()
 On Monday 26 th June 2006, Bursamalaysia launched its FTSE series of indices. Will be interesting to see what sort of contract specs come out of the FBM30 futures expected to be launched by the exchange.
posted by emacro @ 4:00 PM
0 comments
![]()
![]()
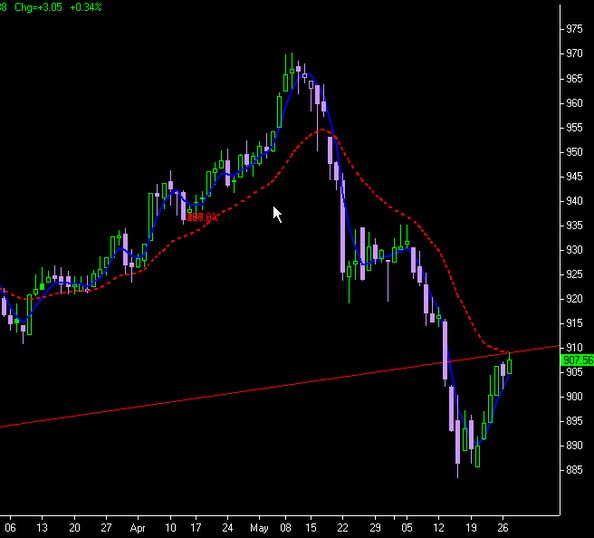 20060627 2:57 pm. Finally we get the KLCI to pull back to the trendline.
posted by emacro @ 3:01 PM
0 comments
![]()
![]()
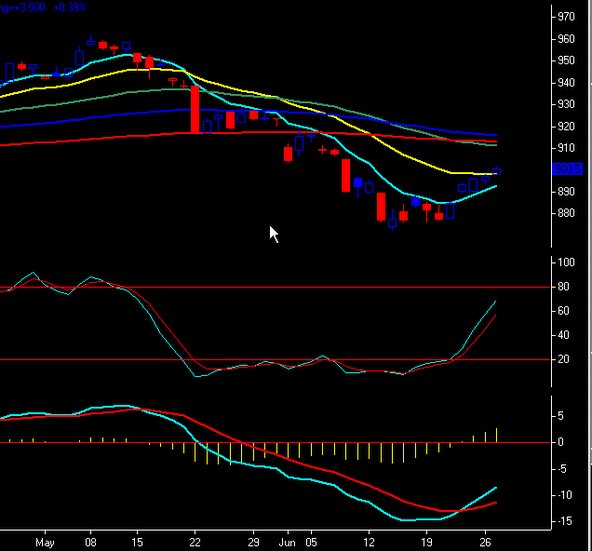 20060627 Lunch session break. The FKLI June contract continues up on "path of least resistance".
posted by emacro @ 2:19 PM
0 comments
![]()
![]()
posted by emacro @ 5:19 PM
0 comments
![]()
![]()
 20060626 10;20 am. FKLI reaches 21 ema resistance. Since the stochastics and macd indicates path of least resistance is on upside, may be good to long on retrace to the 8 ema.
posted by emacro @ 10:39 AM
0 comments
![]()
![]()
 20060622 4:10 pm. We would look to take longs when FKLI comes back to retest the daily 8 exponential moving average support.
posted by emacro @ 4:16 PM
0 comments
![]()
![]()
 20060622 9:11 am. FKLI broke out yesterday from triangle. Cash KLCI targeting back to the trendline breakdown of 2 weeks ago.
posted by emacro @ 9:28 AM
0 comments
![]()
![]()
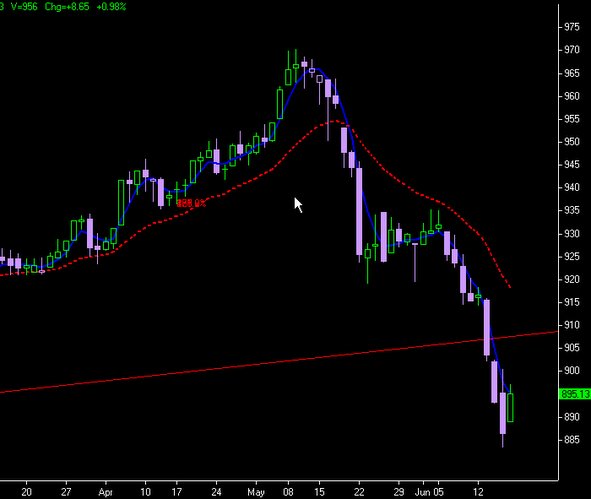
 20060616 Closing FKLI daily chart shows stochastics giving a heads up.
posted by emacro @ 5:28 PM
0 comments
![]()
![]()
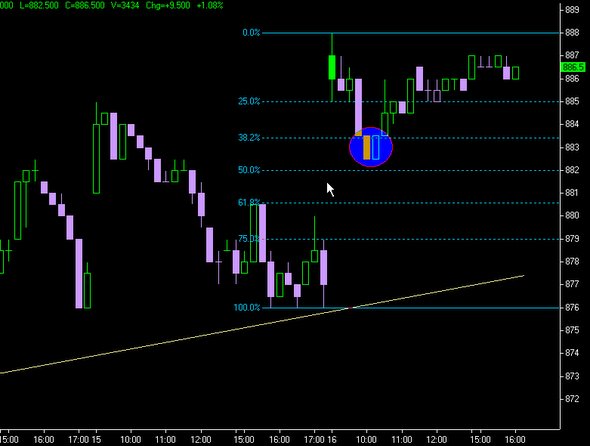 20060616 3:50 pm. FKLI bounce came off the 38.2% retracement Fib level for a nice trade long.
posted by emacro @ 3:56 PM
0 comments
![]()
![]()
 20060616 Cash KLCI a way away from the broken trendline. Can it get back up there for the retest?
posted by emacro @ 10:41 AM
0 comments
![]()
![]()
 20060616 10:05 am. FKLI breaks out of our down trend channel. Now pulls back. Maybe can look for retracement levels to go long.
posted by emacro @ 10:12 AM
0 comments
![]()
![]()
 20060615 11:20 am. FKLI 60 min at upper channel line. Either breaks above or continues downtrend. If our scenario of the cash index going back up to retest the broken trendline eventuates, then favour the former, else the downtrend is set to continue.
posted by emacro @ 11:35 AM
0 comments
![]()
![]()
 20060614 3:52 pm. Cash index broke long term trend line from yesterday. Looks like could retrace back to that trendline. FKLI has rebounded from low of 872 this morning to 881 currently, pointing to high probability of the cash index coming back up to test the trendline.
posted by emacro @ 3:58 PM
0 comments
![]()
![]()
posted by emacro @ 11:00 AM
0 comments
![]()
![]()

posted by emacro @ 4:38 PM
0 comments
![]()
![]()

posted by emacro @ 5:25 PM
0 comments
![]()
![]()
 20060609 30 min FKLi chart, 2 touches of Bollinger bands indicates the reversal, along with Wolffe wave support.
posted by emacro @ 3:17 PM
0 comments
![]()
![]()
 20060609 10:24 am. A pattern called a Wolffe wave, 5 waves complete, should be bouncing off support and headed for the upper trend line.
posted by emacro @ 10:33 AM
0 comments
![]()
![]()
 20060608 FKLI since the break out of the moving average confluence finally reaches downwards. Slow market, to take 3+ days to move down to current levels.
posted by emacro @ 9:24 AM
0 comments
![]()
![]()
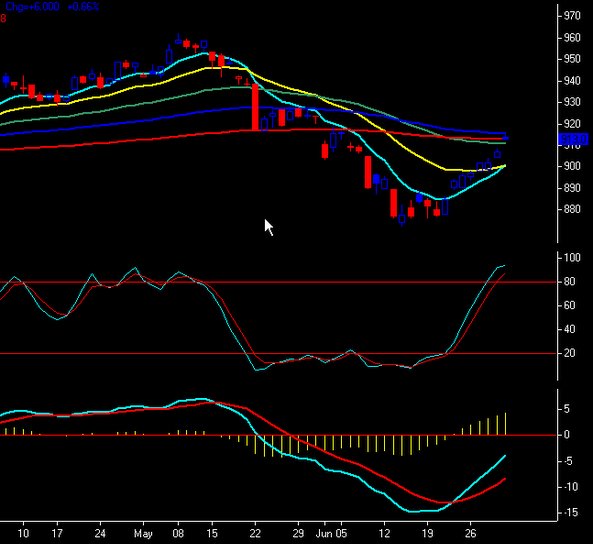
 20060606 FKLI into the close, holding below the 100 mov avg and RSI is below 50, momentum is down, but opportunity to look for support level to consider longs.
posted by emacro @ 9:30 PM
0 comments
![]()
![]()


