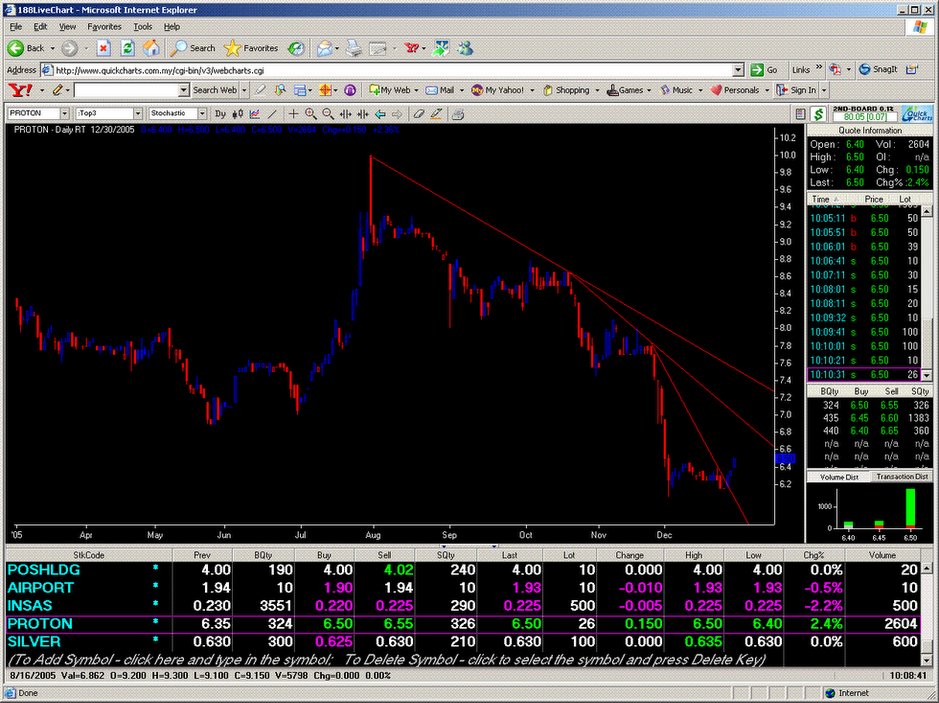
 20051230 10:10 am. Proton Holdings, is in a possible reversal, having broken the third downtrend line.
posted by emacro @ 10:10 AM
0 comments
![]()
![]()
This will chronicle trading in the FKLI & FCPO futures. If you don't like what you see/read in this blog, just surf away. These opinions are our personal opinions and just a record of our thoughts..."In evolution, it’s not the biggest, the fiercest nor the smartest that survive, it’s the one that changes the fastest.” I.e. the key word is to adapt the trading style to the markets, until it stops working
20051230 10:10 am. Proton Holdings, is in a possible reversal, having broken the third downtrend line.
posted by emacro @ 10:10 AM
0 comments
![]()
![]()
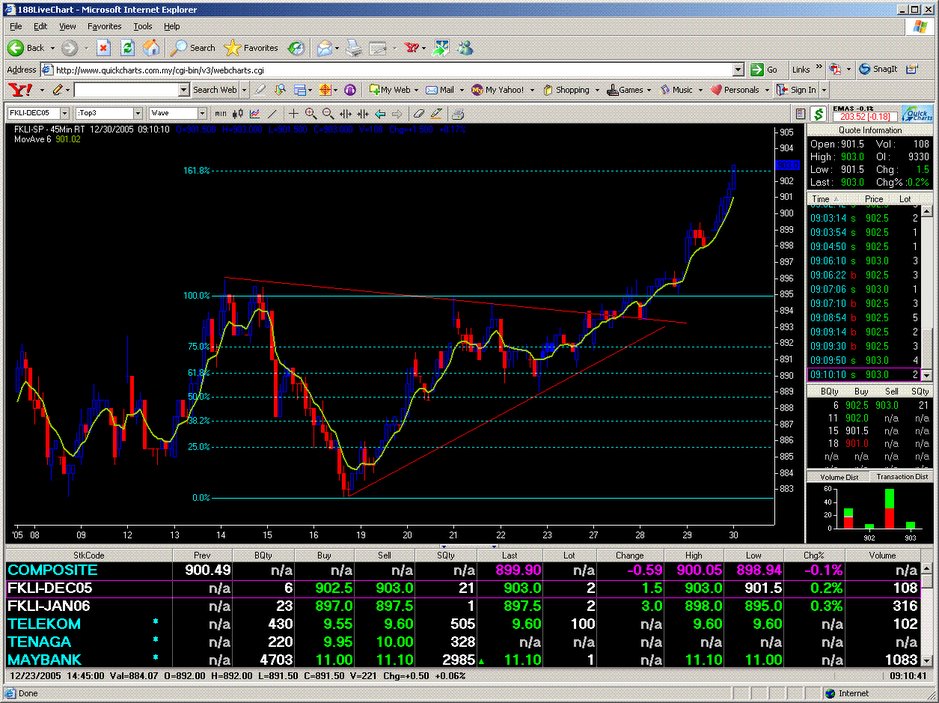 20051230 9:11 am. Reaches the 161.8% fibonacci extension, which woud be good levels to take profits.
posted by emacro @ 9:12 AM
0 comments
![]()
![]()
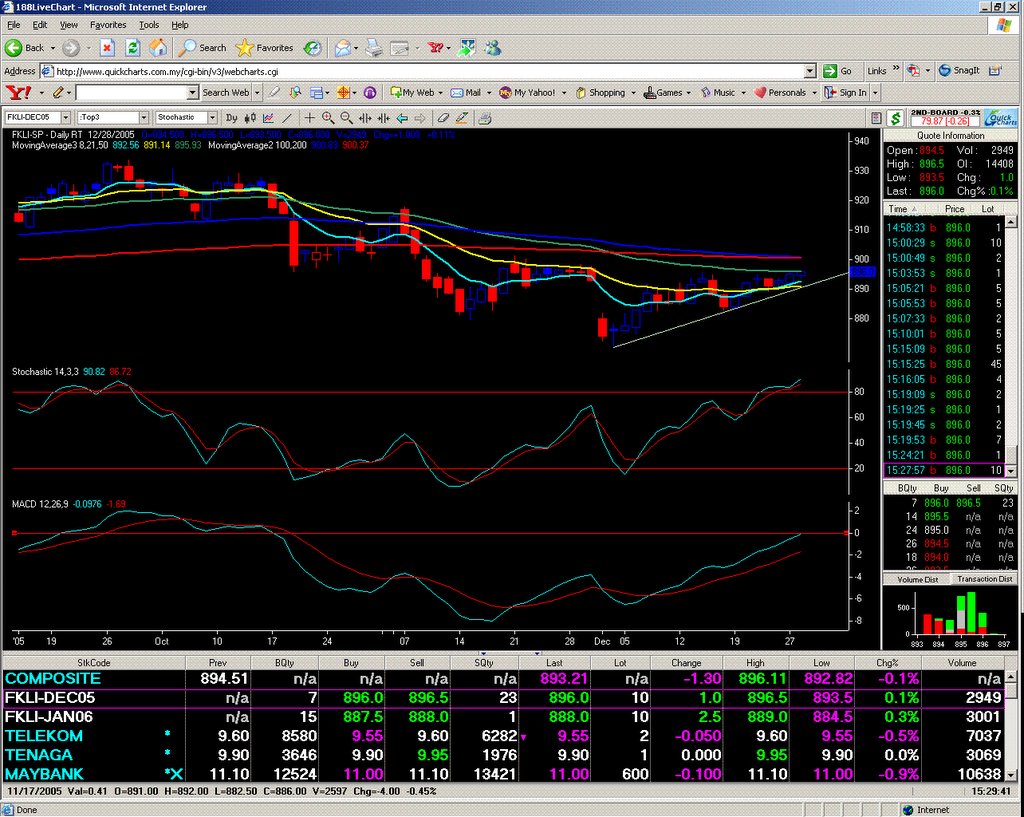
 20051229 Stochastics continues to be o/b, but MACD still bullish. FKLI spot month settled at 901.50 at the close.
posted by emacro @ 5:24 PM
0 comments
![]()
![]()
 20051229 9:00 am. Continuation of the uptrend from the breakout entry (893.50) The uptrend lines deineate the trend in place.
posted by emacro @ 9:01 AM
0 comments
![]()
![]()
 20051228 Stochastics moving further into oberbought, but the MACD is still bullish. Prices shrug off the overnight fals on Wall St, and contiues the positive vein off the buy signal a few days ago.(Upside break of 893.50)
posted by emacro @ 3:33 PM
0 comments
![]()
![]()
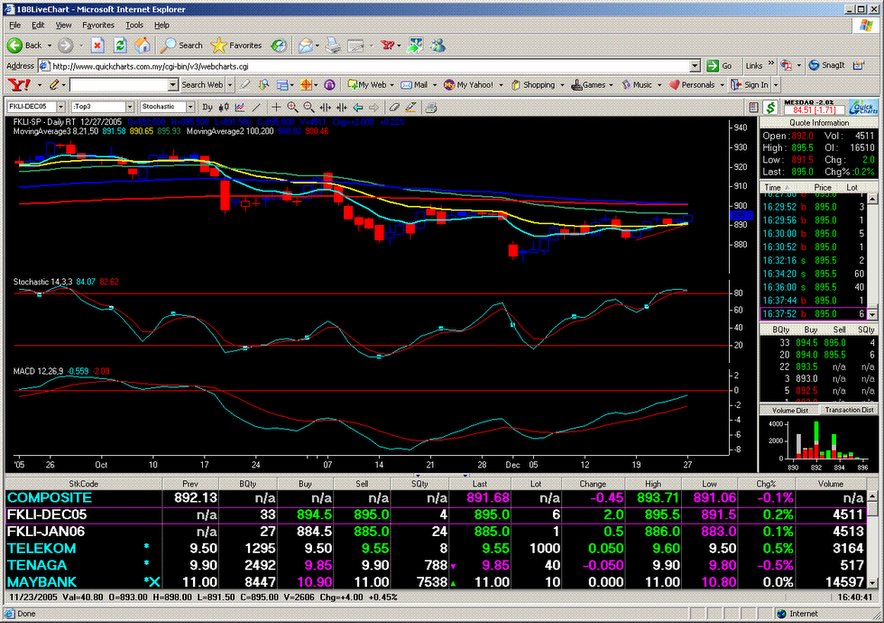 20051227 4:40 pm. After the sideways action finally breaks above 893.50. However trade dominated by rollover activity past few sessions. One thing for sure it is not prudent to short against the daily trend indicators.
posted by emacro @ 4:45 PM
0 comments
![]()
![]()
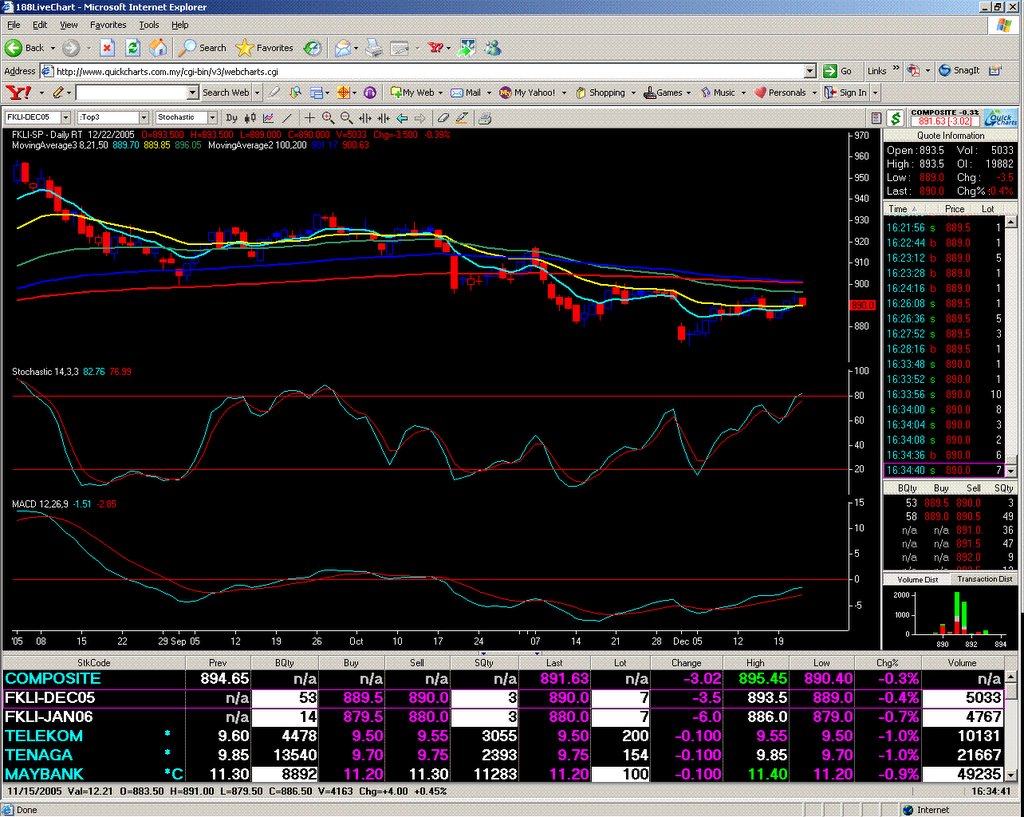 20051222 4:35 pm. FKLI sold off today now trading near lows. Technical indicators show stochastics overbought but MACD is still pointing up, this culd be a correction in the uptrend off oberbought conditions. Price actin though will determine entry back into long position, a break back above 893.50 today's high, would be a good price trigger. Otherwise, stay out and see what happens.
posted by emacro @ 4:37 PM
0 comments
![]()
![]()
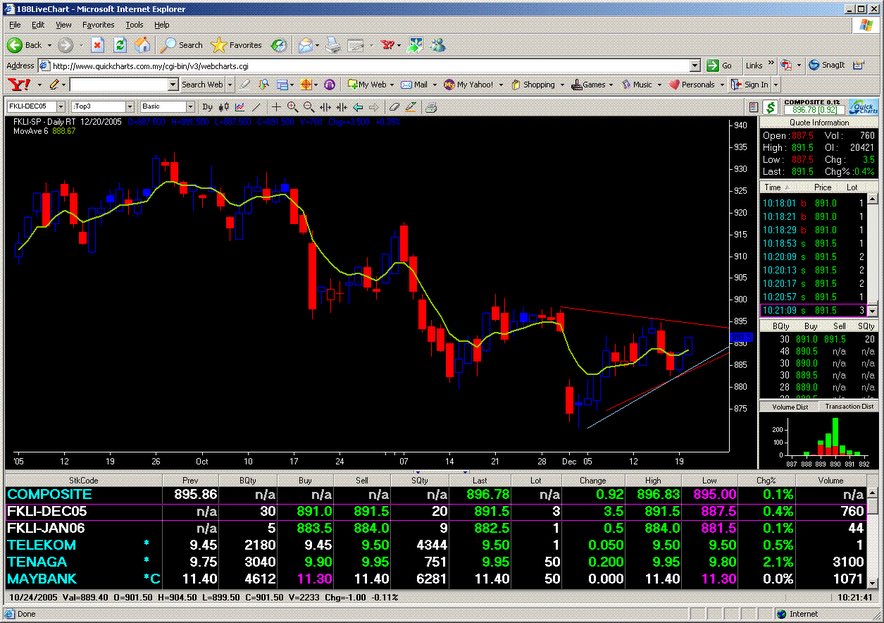
 20051220 Close. The Breakout came to the upside, with the anticipated downside Andres's pitchfork not materialising. In markets, patience will keep traders out of bad positions.
posted by emacro @ 5:19 PM
0 comments
![]()
![]()
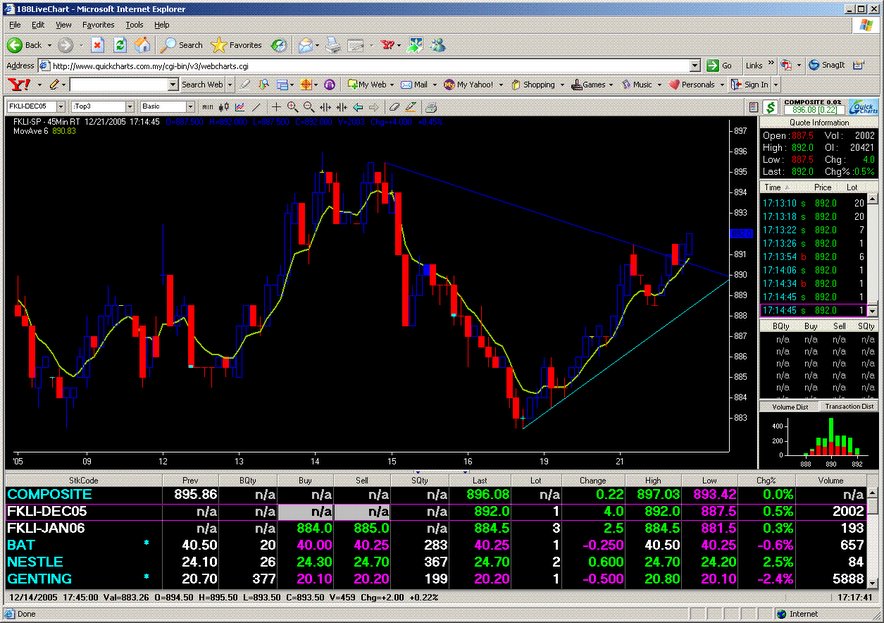
 20051220 Lunch session break. What the lines in the chart signify is the possibility of an Andrew's pitchfork. If the trader believes this is a correction in the downtrend, a short would be in play on the break of the sky blue line, with a stop above the dark blue line. Targets would be the median line and the lower pitchfork line, with the stop trailed to the upper trendline. This is a technique called median line trading. Let's see how this pans out.
posted by emacro @ 2:07 PM
0 comments
![]()
![]()
 20051220 10:23 am. A pattern worth monitoring of a symmetrical triangle or wedge->FKLI poised for breakout of congestion.
posted by emacro @ 10:25 AM
0 comments
![]()
![]()
 20051214 10:19 am. Progress upwards continues on the break out of the channel. A target would be the width of the channel 10 pts extended upwards to 902.50.
posted by emacro @ 10:21 AM
0 comments
![]()
![]()
 20051213 3:28 pm. Testing and trying to break the top of the range.
posted by emacro @ 3:29 PM
0 comments
![]()
![]()
 20051212 Closing. The breakout in the morning was a false one, turning into a fake out. FKLI did it's own thing disregarding the strong gains in regional bourses. This is a characteristic of a market shunned by foreigners, save those who 'speculate' n the value of the ringgit. Pattern is sideways, looking for breakouts would be the horizontal line levels.
posted by emacro @ 8:17 AM
0 comments
![]()
![]()
 20051212 8:45 am. Gaps up on opening. Nikkei 225 futures +270. This is a beak out of 2 'triangle' patterns, which could lead to follow through. Let's see what happens.
posted by emacro @ 8:56 AM
0 comments
![]()
![]()
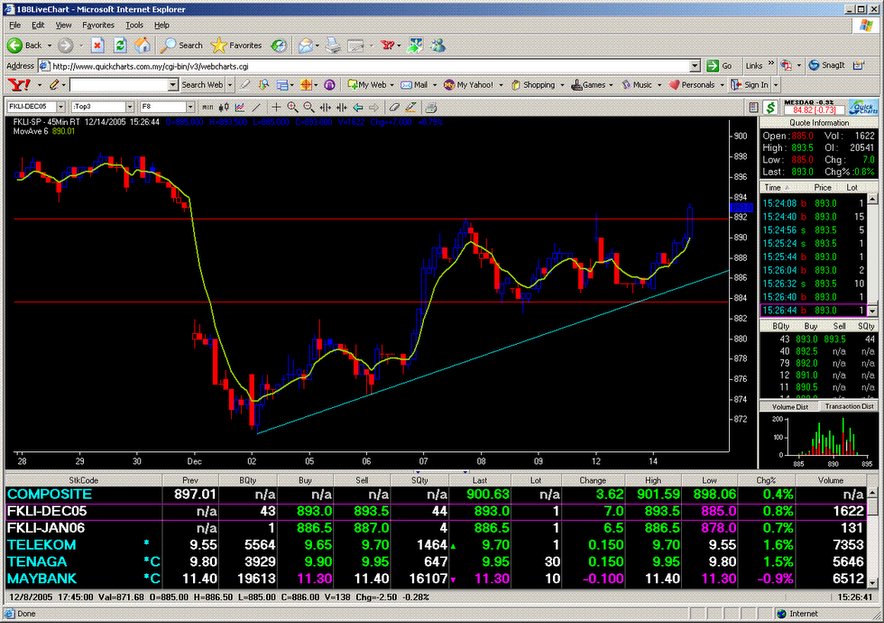
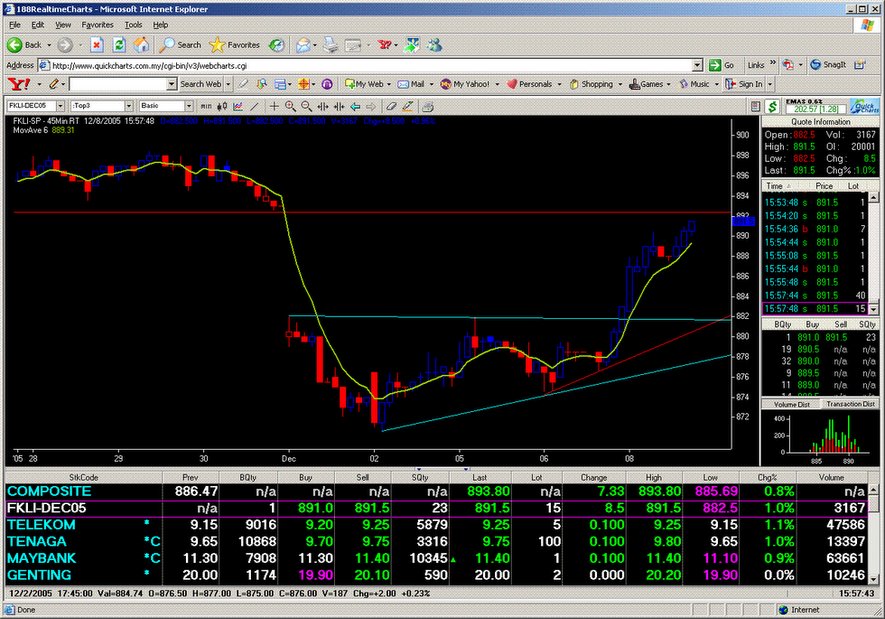
 20051208 'Grail' buy is yielding anwhere between 3 to 5 points.
posted by emacro @ 11:48 AM
0 comments
![]()
![]()
 20051208 12:36 pm. This setup is called the Holy Grail. 45 min chart fkli is in a strong trend s the ADX is greater than 30, starts to pull back, along with prices to the 21 ema. Long trade is signalled with a target of retesting the highs 892.
posted by emacro @ 12:37 PM
0 comments
![]()
![]()
 20051207 3:58 pm. Classical technical analysis would suggest the triangle breakout pattern ha reached the target equal to the height of the triangle. The disciplined trader might take profits and reassess the next setup.
posted by emacro @ 4:01 PM
0 comments
![]()
![]()
 20051207 Fib retracement provide target levels to scale out of long position.
posted by emacro @ 9:26 AM
0 comments
![]()
![]()
 20051206 Close: A breakout from the triangle pattern, target could be 886 to 888 area.
posted by emacro @ 5:41 PM
0 comments
![]()
![]()
 20051206 3:20 pm. Trapped in between the trendlines in a range. Needs to break out either side for the trade.
posted by emacro @ 3:24 PM
0 comments
![]()
![]()
 20051205 10:14 am. Trying to get to the point of beginning to fill the gap. This is one situation where 'bottom fishing' has high probability of success.
posted by emacro @ 10:18 AM
0 comments
![]()
![]()
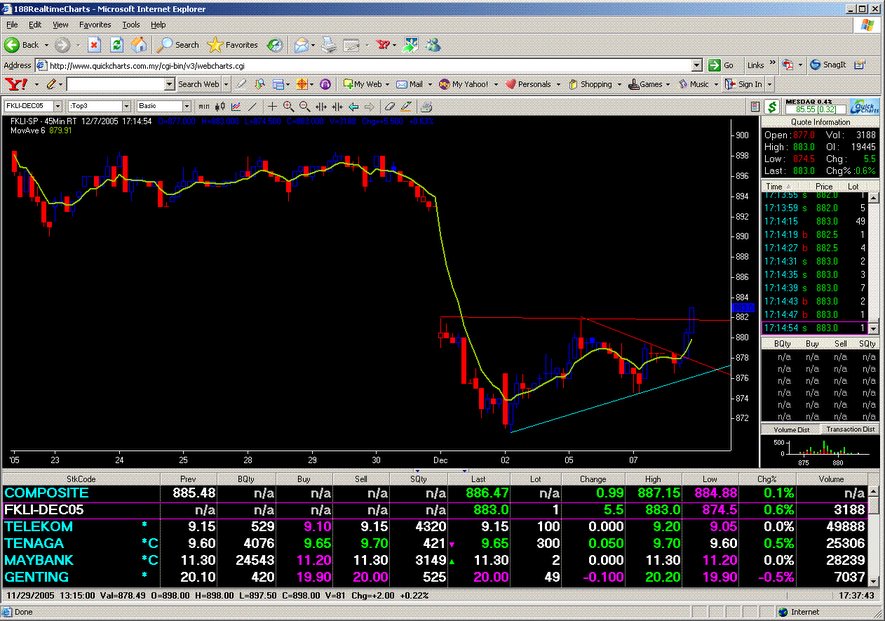
 20051130 FKLI gap down today, forms a possible trade pattern called a Wolffe Wave, to buy at the market on the touch of the lower trendline, and with the gap upside, good probability of profitable trade.
posted by emacro @ 5:49 PM
0 comments
![]()
![]()


