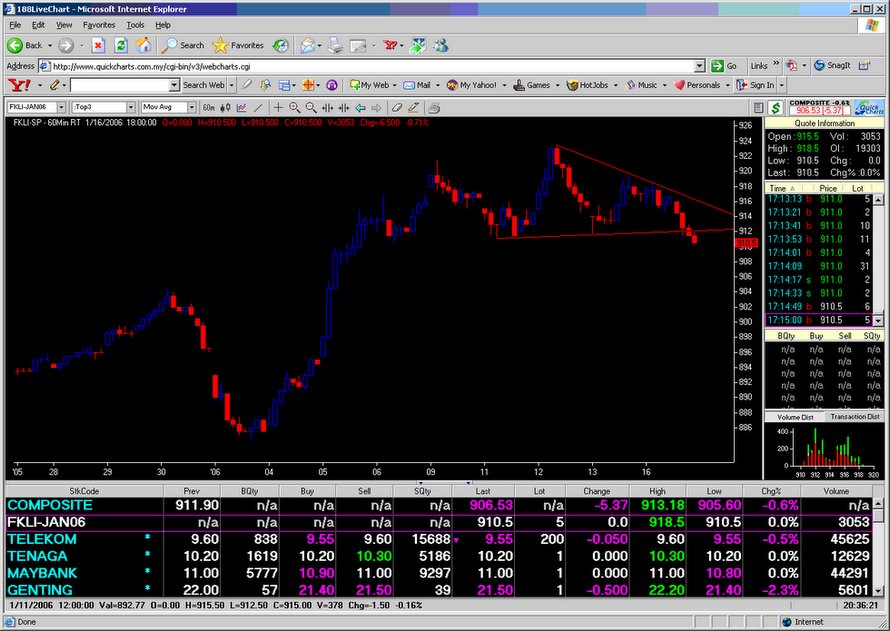
 20060116 The 60 min chart pattern is the thing against the long position, showing a break of a triangle pattern. However, daily charts show support from 50,100 and 200 ema at aroun 905 level. We have 2 factors for the trade, underlying support on daily chart and 15 min, but a triangle pattern break. Odds favour the long side.
posted by emacro @ 8:39 PM
0 comments
![]()
![]()


0 Comments:
Post a Comment
<< Home