Monday, June 30, 2008


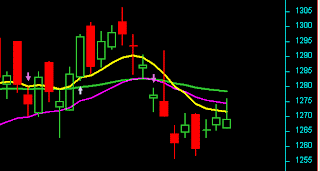
20080630 1213. An example of a scalp trade going wrong for th eFKLI futures.


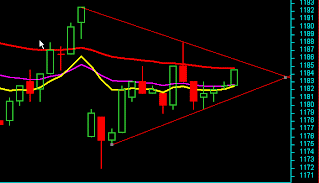
200880630 1123. It's now or never for FKLI Jul to move up on the short term 2 min chart.

20080630 The Jun/Jul spread on FKLI is frozen at 15.50 without any opening auction matching. This despite the June contract trading at 1184 and July at 1163.5. Crazy system Bursamalaysia has implemented?

Friday, June 27, 2008


20080627 0857. FKLI July futures opens gap down, continuation after the downside break we saw yesterday.


20080626 Is this the final climactic sell off in US equity markets? Well, the H&S pattern trigger gave us the heads up on the current sell off couple of weeks back.

Thursday, June 26, 2008


20080626 1616. Downside break is on for the FKLI futures, although the initial upside break failed.


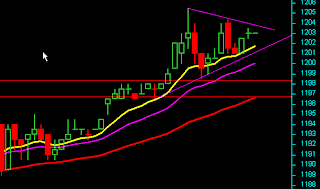
20080626 1132. A triangle consolidation pattern forms on FKLI futures, indications that the spring is coiling.


20060626 0917. FKLI futures spot month reaches high of 1205.5 this morning. Watching retracement levels today.

Wednesday, June 25, 2008


20080625 1706. Well FKLI futures moving on from the long breakout. Now trades at 1201 level. Price action is more important than emotion in trading the markets. the fact of the matter was that 90% of players were dead set 'BEARISH", precipitating the rally in futures, which closes the discount to the cash index today.

Tuesday, June 24, 2008


20080624 0944. FKLI upside breakout has legs, continuation in the price action this morning. You do not always have to swim with the tide to make money in markets.

Monday, June 23, 2008


Someone left a comment on the previous post:"Swim along the current. There is no way we can beat the trend." Very poignant, as the daily chart of the KL Composite Index cash shows. Which way is the tide flowing?


20080623 1519. Failed break to the downside, now on upside break. Will see if this FKLI futures trade is another whipsaw.


20080623 1224. FKLI futures is forming a triangle pattern consolidation on the 15 min chart. Indications for breakout either side soon.

Thursday, June 12, 2008


20080612 1627. 5 min chart FKLI futures (got it right this time). Just follow the trend and one should be ok.

20080612 1507. Sorry meant ot be 15 min chart in the last post on the FKLI futures chart.


20080612 1128. FKLI futures 5 min chart indicating downtrend? The moving averages are telling the story, but could be distortion due to the big gap down in prices this morning.

Wednesday, June 11, 2008


20080611 1707. FKLI futures made a high print of 1223 in this uptrend.


20080611 1234. Going into the lunch session break, the uptrend on FKLI futures today continues, albeit slowly grinding up. Moving averages can be invaluable aids to trading.


20080611 1040. Uptrend in FKLI futures today. In trading, it is important to be aware of the trend, in the timeframe that one is trading off.

Tuesday, June 10, 2008


20080610 1436. Continuation of the downward move on the FKLI futures. This chart is worth putting in the memory bank.


20080610 1050. A reasonable move down for the scalp trade.


20080610 1017. Going to try a short here 1212.5-13.5, for a scalp trade.

Friday, June 06, 2008


20080606 0915. FKLI futures contiues the 5 min trend, in reaction to positive movements on US markets.

Thursday, June 05, 2008


20080605 1710. To complete the picture of the afternoon session KLCI futures trade.


20080605 1557. A high print of 1215.5 on the FKLI futures, a struggle, so guess that is that.

1622. FKLI futures reached 1218. An instructive chart on how the market moves up.


20080605 1503. Conditions may be right for the rebound to continue in FKLI futures on the 5 min chart. Trades at 1213 now.

Wednesday, June 04, 2008


20080604 FKLI futures hourly chart tells the story of the price action after the double top break in the cash market.

Tuesday, June 03, 2008

20080603 FKLI futures fall further. The double top formation on the KLCI means bulls get the hammering over the past few hours.


20080603 1020. A selloff in FKLI futures, in reaction to Wall St falls overnight. Having an idea of the 'big picture' helps in positioning to take advantage of these sort of downside moves.

Monday, June 02, 2008


20080602 KLCI in the bigger picture is still below the 1270 level, which is bearish as we alluded to last week.


20080602 1647. FKLI June futures trendline break buy on 5 min.


20080602 1044. Cash KLCI drops 9 points, but FKLI remains well bid. We are scratching our heads wondering...


"There is the plain fool who does the wrong thing at all times anywhere, but there is the Wall Street fool who thinks he must trade all the time."J Livermore Manchester City FCl Crude Palm Oil

fcpo.blogspot.com


From Dragons and Bulls by Stanley Kroll
Introduction and Foreword
The Importance of an Investment Strategy
5 The Art of War, by Sun Tau (circa 506 BC) and The Art of Trading Success (circa AD 1994)
That's the way you want to bet
Long-term v Short term trading
Technicals v Fundamentals
Perception v Reality
Part 1: Winners and Losers
Part 2: Winners and Losers
Sun Tzu: The Art of War
Those who tell don't know, those who know don't tell
Why there is no such thing as a "bad market"
The Secret to Trading Success
The Experts, do they know better?
Risk control and money management
Larry Hite: The Billion Dollar fund Manager
Systems Trading:Kroll's Suggested Method
Buy the Strength Sell the Weakness
Good advice
The 'good bets' business by Larry Hite
Don't lose your shirt
Ed Sykota's secret trend trading system