Tuesday, November 29, 2005

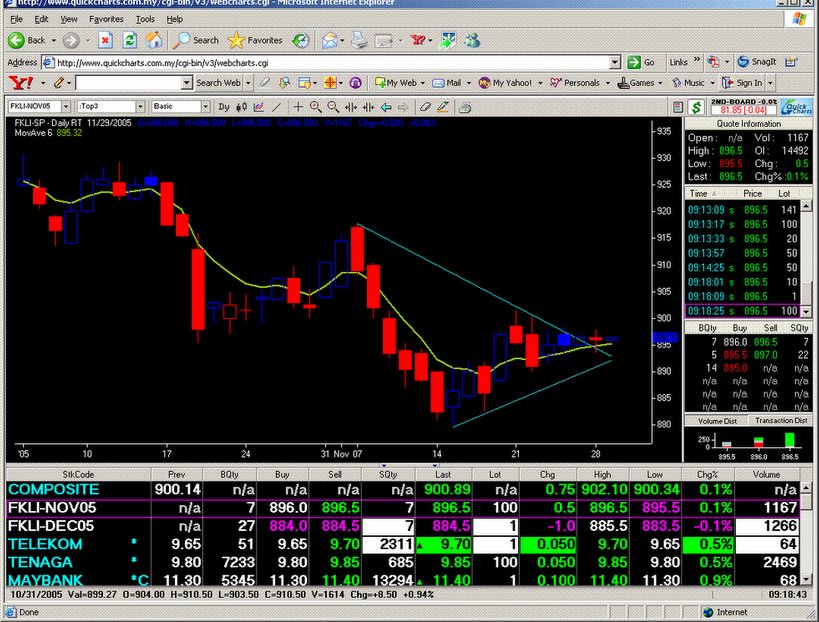
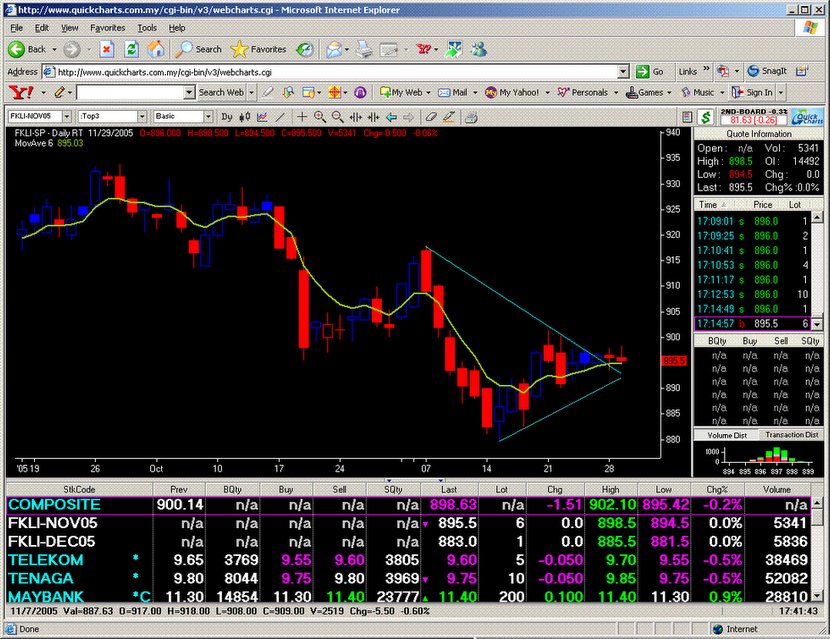
20051129 Close. Sidewas to down movement after the triangle breakout. Would be prudent to square position, wait for next setup. An abject lesson that technical analysia, its patterns and indicators; nothing is 100% correct. It is important to have the mindset to accept that things are not working out as expected, and move on to the next trade. Posted by Picasa

20051129 9:18 am. Update on the triangle pattern. Broke out, but with reserved convictions. Tomorrow will expire the Nov FKLI, see how this technical pattern pans out. Posted by Picasa

Friday, November 25, 2005

20051125 Close: An Inside Day (ID) pattern, with the symmetrical triangle with prices reaching the apex, sees FKLI poised to make an explosive breakout move either direction next week. Posted by Picasa

Thursday, November 24, 2005

20051124 12:45 pm session break. FKLI consolidating to form a symmetrical triangle. The last trade long around 893 turned ut to be ok, with Nov FKLI reaching high 898.50. The pattern will pan out to a breakout either side of the triangle. Posted by Picasa

Wednesday, November 23, 2005

20051123 11:57 am. Cash chart daily shows trend up, as the indictors stil point up. Would use this to manage the trade holding on until the indicators point down. Posted by Picasa

Tuesday, November 22, 2005

20051122 45 min chart Posted by Picasa

2005122 So if we took a long position at the support levels indentified just after lunch (892-894), what do we have going for the position? 1) The day trend is stil up, as the daily macd and stochastics have not crossed down and 2) the FKLI is trading at a big discount to cash index with less than a week to expiration. Net net the position has a good risk-reward equation. However things may yet change, depending on the price action next day or so. Posted by Picasa

20051122 Close. A ZLR sell signal given b the CCI momentum indicator. The settlement long trade is now few points underwater, but yeat to see what will eventuate come settlement next week. Maybe can let the cash index (which has not confirmed the fkli next leg down) reaches 895, the reevaluate on whether to average (bad word here) or take further action. Posted by Picasa

20051122 2:47 pm FKLI is resting on a confluence of support at 894. A good trade idea is to buy on weakness with a view of holding till expiry Nov contract. With a gross mispricing discount of -10 points is a good risk reward play. Posted by Picasa

Friday, November 18, 2005

20051118 11:59 am. FKLI moves up strongly. Once the short covering finishes, a day trade idea might be to buy pullback to the moving average or trendline. There is strong band of support underneath at 886. Posted by Picasa

Tuesday, November 15, 2005

20051115 10:41 am. The expected rebound came propelled by stop orders triggering. Posted by Picasa

Monday, November 14, 2005

20051114 Continuation of selling on key blue chips pushes FKLI down again. So the ZLR sell signal turned out to have follow through. On this move is 6 consecutive days of falls. Usually after 8 to 9 days of falls, the markets rebound technically. Would look to scale into some long positions by tomorrow given the overextended discount of the futures v cash. Posted by Picasa

Friday, November 11, 2005

20051111 11:28 am. 15 min chart FKLI is scribing a range 887-894. Possible strategy of shorting the break down or long the breakout. Posted by Picasa

Thursday, November 10, 2005

20051110 Buying at support levels 888, would provide small bounce trade, targeting 895. Posted by Picasa

20051011 3:01pm. FKLI reaches a pivotal support level. Possible to trade long for bounce back up to 894 on the mov avg. Posted by Picasa

Wednesday, November 09, 2005

20051109 With the cash at the support, FKLI sells off into a weak closing, coming off the ZLR sell signal yesterday. Tomorrow will look to bu some support levels, generated by the pivots after the market opens. Posted by Picasa

20051109 2:50 pm. Daily chart of cash index shows some trendline support at the relatively new trendline. Maybe will bounce off the 900 level. Posted by Picasa

20051108 9:57 am. Down arrow denotes a sell signal ZLR from yesterday close. FKLI makes further ground downside. Support comes in at 892 and 895 for today. 892 will be a good level to scalp long. Posted by Picasa

Tuesday, November 08, 2005

20051108 5:07 pm. Into the close, 45 min chart. Note the arrows showing short entries with ZLR signal with the trend. Posted by Picasa

20051107 The Composite Index cash is forming a wedge/triangle, which could break out either side. Posted by Picasa

Wednesday, November 02, 2005

20051102 Going into the 2 day break for Hari Raya celebrations, the FKLI narrowed the discount and settled against the 50 day moving average. Buy signal on Monday turned out to be a good one. Since the cash index is about 4 points off its 50 day moving average, expect a little more upside for the FKLI. 920 can be a level for shorts for scalps. Posted by Picasa

20051102 4:59 pm. The 15 minute chart of the FKLI shows the move up form the symmetrical triangle. Posted by Picasa

20051102 3:21 pm. After the rollover into Nov for the fkli, the buy signal indicated last Friday by the CCI pattern bears fruit, as those overzealous bears selling at huge discounts now have to cover, providing impetus for the fkli to trade almost even money to the cash. Posted by Picasa


"There is the plain fool who does the wrong thing at all times anywhere, but there is the Wall Street fool who thinks he must trade all the time."J Livermore Manchester City FCl Crude Palm Oil

fcpo.blogspot.com


From Dragons and Bulls by Stanley Kroll
Introduction and Foreword
The Importance of an Investment Strategy
5 The Art of War, by Sun Tau (circa 506 BC) and The Art of Trading Success (circa AD 1994)
That's the way you want to bet
Long-term v Short term trading
Technicals v Fundamentals
Perception v Reality
Part 1: Winners and Losers
Part 2: Winners and Losers
Sun Tzu: The Art of War
Those who tell don't know, those who know don't tell
Why there is no such thing as a "bad market"
The Secret to Trading Success
The Experts, do they know better?
Risk control and money management
Larry Hite: The Billion Dollar fund Manager
Systems Trading:Kroll's Suggested Method
Buy the Strength Sell the Weakness
Good advice
The 'good bets' business by Larry Hite
Don't lose your shirt
Ed Sykota's secret trend trading system